Flow Induced Vibration Calculations (Metric Only)
Summary
Repeated vibration on a piping system can result in vibration induced fatigue and failure. Pipe failure due to vibration creates safety concerns for personnel and environmental contamination, as well as costly downtime and repairs. Despite these concerns, vibration sources and resulting fatigue are often not addressed by design standards. Instead, designers and operators often react to vibration issues rather than prevent and avoid these issues proactively.
In response to vibration concerns, the Energy Institute developed the Guidelines for the Avoidance of Vibration Induced Fatigue Failure in Process PipeworkEnergy Institute, Guidelines for the Avoidance of Vibration Induced Fatigue Failure in Process Pipework, 2nd Edition, Energy Institute, London, UK, 2008. [Online]. Available: https://publishing.energyinst.org/topics/asset-integrity/guidelines-for-the-avoidance-of-vibration-induced-fatigue-failure-in-process-pipework.. These guidelines provide sources of vibration for engineers to consider, many of which can be identified or modeled in an AFT application as found in the Table 1 below.
Table 1: Vibration sources and applicable AFT Application
| Vibration Sources | AFT Application | |
|---|---|---|
| Surge | Sudden changes to flow/pressure | AFT Impulse / AFT xStream |
| Cavitation | Vapor formation and collapse | AFT Fathom / AFT Impulse |
| Reciprocating Equipment | Identify resonant frequencies to avoid during operation | AFT Impulse PFA Module / AFT xStream PFA Module |
| FIV | Turbulence from flow discontinuities | AFT Fathom / AFT Arrow |
| FIP | Excitation at dead end branches | AFT Arrow |
| AIV | High frequency acoustic energy | AFT Arrow |
These guidelines provide a structured approach to identify, assess, and correct vibration concerns through qualitative and quantitative methods. AFT has developed a Flow Induced Vibration Calculations spreadsheet which, in conjunction with model output and user input, can perform the recommended quantitative assessment of different vibration sources. These calculations used with the Energy Institute guidelines will help engineers identify and address vibration concerns in their systems.
In this example, learn how to use AFT Arrow to help calculate the Likelihood of Failure (LOF) for Flow Induced Vibration (FIV), Acoustic Induced Vibration (AIV), and Flow Induced Pulsation (FIP) in accordance with Energy Institute Guidelines to avoid vibration induced fatigue failure.
Topics Covered
-
The cause and concerns of the following vibration sources:
-
Flow Induced Vibration (FIV)
-
Occurs in both compressible and incompressible flow
-
Excitation caused by turbulence from discontinuities or boundary layer separation
-
Generally concentrated at low frequencies (<100 Hz)
-
Can lead to visible vibrations of piping and supports
-
-
Pulsation: Flow Induced Excitation (FIP)
-
Flow past a branch with a dead end or around a component inserted in the flow stream can cause vortices to form
-
If vortices coincide with an acoustic or structural natural frequency, high levels of pulsation can occur
-
Only the mechanism for flow past dead ends is covered by the EI guidelines
-
-
High Frequency Acoustic Excitation (AIV)
-
Pressure loss sources such as control valves, relieve valves, etc. can generate high frequency acoustic energy
-
Can be damaging due to noise output as well as vibration of the pipe walls
-
Can affect pipe support and connections
-
Typically, frequencies are in the range of 500 - 2000 Hz
-
-
-
Required calculation parameters for FIV
-
Excel Export Manager
-
Use of AFT vibration analysis spreadsheet
Required Knowledge
This example assumes the user has already worked through the Beginner - Air Heating System example, or has a level of knowledge consistent with that topic. You can also watch the Arrow Quick Start Videos, as they cover the majority of the topics discussed in the Beginner: Air Heating System example.
Model Files
This example uses the following files, which are installed in the Examples folder as part of the AFT Arrow installation:
Problem Statement
This example will examine three different vibration source types:
Note: Use the links in the example to jump to the next step when analyzing each type of vibration source.
Note: Tables below show the specific values used in this model, but the steps in this Example can be used to calculate the LOF for vibration concerns in any model.
Turbulence is common in most practical piping systems. In this example, we will examine turbulence in straight pipes, caused by the boundary layer at the pipe wall, with its intensity depending on the flow regime, characterized by the Reynolds number. However, in typical scenarios, major flow disturbances like process equipment, partially closed valves, sharp bends, tees, and reducers are the primary sources of turbulence.
Reference: Pages 48-53, Section T2.2, Flowchart T2-1
Purpose: Determine the LOF by looking at the part of the main line with most turbulence and the greatest distance between supports
Input Values/Sources/Descriptions:
Table 2: Input Values/Sources/Descriptions
| Inputs | Example Value | Source | Description |
|---|---|---|---|
| L,span | 1 m | User Input | Max span length between supports |
| T | 7.112 mm | User Input | Thickness of pipe wall |
| fn (adv. only) | 1 Hz | User Input | Structural natural frequencies |
| D,int | 154.051 mm | AFT Export | Internal pipe diameter |
| ρ | 1.3452 kg/m3 | AFT Export | Fluid density (static) |
| v | 348.1983 m/sec | AFT Export | Fluid velocity |
| μ (gas only) | 0. Pa-sec | AFT Export | Dynamic viscosity |
Continue to Step 1. Start AFT Arrow
Pulsation: Flow Induced Excitation (FIP)
Flow Induced Pulsation (FIP) occurs when unsteady or turbulent flow excites piping systems, causing pressure fluctuations and mechanical vibrations. In this example, we will explore how turbulence is generated by flow past dead ends.
Reference: Pages 48-53, Section T2.6, Flowchart T2-4
Purpose: Determine main line LOF based on dead leg branch calculations
Input Values/Sources/Descriptions:
Table 3: Input Values/Sources/Descriptions
| Inputs | Example Value | Source | Description |
|---|---|---|---|
| c | 559.254 m/sec | AFT Export | Sonic velocity at branching point |
| d,int | 9.2456 mm | AFT Export | Internal diameter branch |
| D,int | 438.15 mm | AFT Export | Internal diameter main line |
| L,branch | 0.5 m | AFT Export | Length branch |
| Re | 1,378,350.125 | AFT Export | Re at branching point |
| v | 145.7902 m/s | AFT Export | Velocity at branching point |
| ρ | 0.3972 kg/m3 | AFT Export | Gas density in main line (static) |
Continue to Step 1. Start AFT Arrow
High Frequency Acoustic Excitation (AIV)
High Frequency Acoustic Excitation (AIV) can arise due to the rapid release of energy due to irreversible pressure losses at pressure-reducing devices (e.g., control valves, relief valves, etc), or other sources of turbulence. AIV generates acoustic energy that can propagate through piping systems, potentially causing high-frequency vibrations that lead to fatigue, structural damage, and even catastrophic failure. In this example, we will determine the likelihood of failure in the main line based on high frequency sources.
Reference: Pages 59-62, Section T2.7, Flowchart T2-6
Purpose: Determine the LOF in the main line based on high frequency sources (control valves, relief valves, etc)
Input Values/Calculations/Sources/Descriptions:
Note: The use of Duplex Piping Material and Weldolets increases the likelihood of failure. Selecting "no" for Weldolets indicates the assumption that a stronger connection is being used.
Table 4: Input Values/Calculations/Sources/Descriptions
| Inputs | Example Value | Calculations | Source | Description |
|---|---|---|---|---|
| Low Noise Trim | 0 dB | Sources | User Input | Reduction in sound level due to low noise valve trim |
| Sound Power Level (PWL) | Multiple from export | Sources | User Input | Acoustic power at the pressure loss |
| d,ext | 457.2 | Discontinuities | User Input | Branch external diameter |
| L,dis | See Table 5 | Discontinuities | User Input | Distance from source to discontinuity |
| Duplex Piping Material | N | Discontinuities | User Input | Y if piping material is duplex, N if not |
| T | 9.5 mm | Discontinuities | User Input | Wall thickness main line |
| Weldolet | Y | Discontinuities | User Input | Y if discontinuity is weldolet type fitting or N if not |
| D,int | 438.15 mm | Discontinuities | AFT Export | Main line internal diameter |
Table 5: L,dis values for junctions
| Vibration Source Junction | Distance to Downstream Discontinuity |
|---|---|
| J2 | 20 m |
| J3 | 19 m |
| J4 | 13 m |
| J5 | 10 m |
Step 1. Start AFT Arrow
From the Start Menu choose the AFT Arrow 10 folder and select AFT Arrow 10.
To ensure that your results are the same as those presented in this documentation, this example should be run using all default AFT Arrow settings, unless you are specifically instructed to do otherwise.
Step 2. Open the Model
Open the Metric - Flow Induced Vibrations Calculations.aro model file.
The Workspace should look like Figure 1.
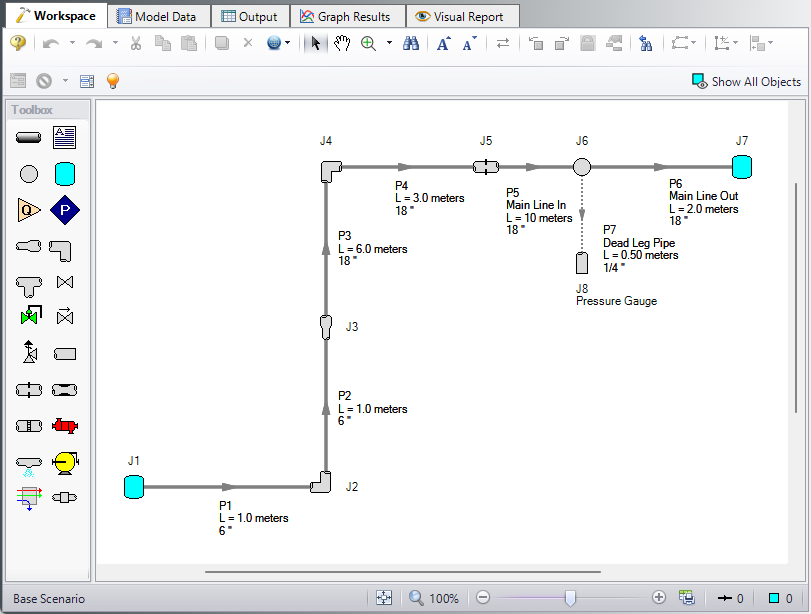
Figure 1: Flow Induced Vibrations Calculations Model on the Workspace
Step 3. Run the Model
Click Run Model on the toolbar or from the Analysis menu. This will open the Solution Progress window. This window allows you to watch as the AFT Arrow solver converges on the answer. Once the solver has converged, view the results by clicking the Output button at the bottom of the Solution Progress window.
Step 4. Excel Export Manager
-
From the Workspace, click the Excel Export Manager button on the toolbar, then click Open.
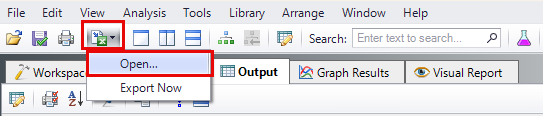
Figure 2: Opening Excel Export Manager from the Workspace
With Excel Export Manager window open, use instructions below for applicable vibration source:
-
The Excel Export Manager window appears. Click the FIV Calcs Gases tab at the bottom of the window if it is not already selected.
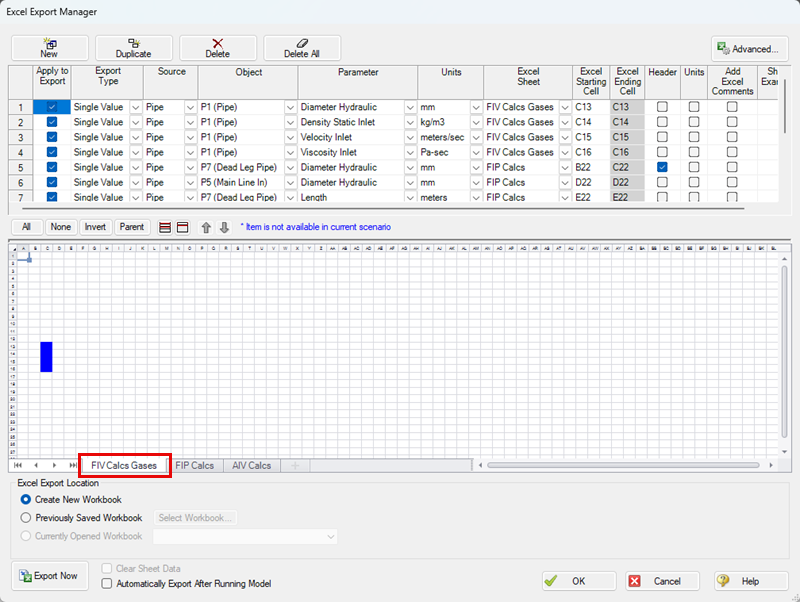
Figure 3: Excel Export Manager window with the FIV Calcs Gases tab selected
-
Note that the top four rows of the Excel Export Manager have been pre-populated with the following information (Table 6). P# (Pipe) is the same for all rows.
Table 6: Excel Export Manager parameters for FIV calculations
| Object | Parameter | Units | Excel Sheet | Excel Starting Cell | Header | Units |
|---|---|---|---|---|---|---|
| P# (Pipe) | Diameter Hydraulic | mm | FIV Calcs Gases | C13 |

|
|
| P# (Pipe) | Density Static Inlet | kg/m3 | FIV Calcs Gases | C14 |
|
|
| P# (Pipe) | Velocity Inlet | meters/sec | FIV Calcs Gases | C15 |
|
|
| P# (Pipe) | Velocity Inlet | Pa-sec | FIV Calcs Gases | C16 |
|
|
-
At the bottom, for Excel Export Location, click the radio button for Previously Saved Workbook.
-
The Flow Induced Vibration Calculation Excel spreadsheet should be preselected. If not, click the Select Workbook button, navigate to the Flow Induced Vibration Calculation.xlsx file then click Open. The top four rows of the Excel Export Manager should match the entries in Figure 4 and the bottom section of Excel Export Manager should look like Figure 5.
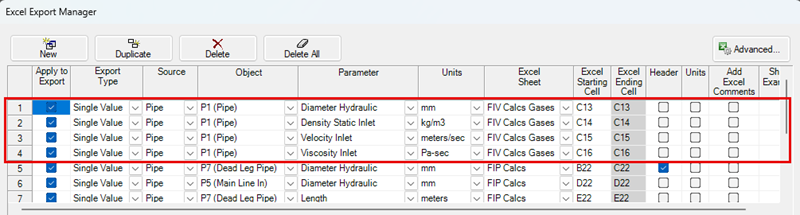
Figure 4: Excel Export Manager window with compressible fluids
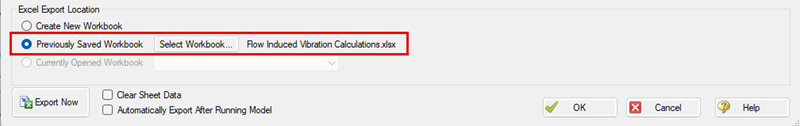
Figure 5: Bottom of the Excel Export Manager window with Flow Induced Vibration Calculations Excel spreadsheet selected as Previously Saved Workbook
-
Once all inputs are confirmed to match Figures 4 and 5 above, click Export Now at the bottom left.
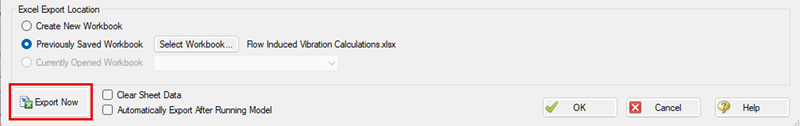
Figure 6: Bottom of the Excel Export Manager window
Continue to Step 5. Vibration Analysis Spreadsheet
Pulsation: Flow Induced Excitation (FIP)
-
The Excel Export Manager window appears. Click the FIP Calcs tab at the bottom of the window if it is not already selected.
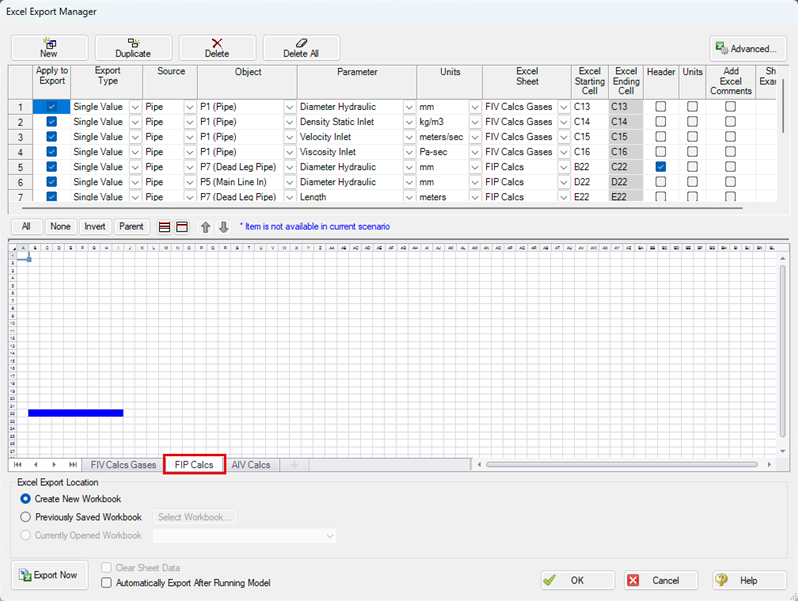
Figure 7: Excel Export Manager window with the FIP Calcs tab selected
-
Note that rows five through eleven of the Excel Export Manager have been pre-populated with the following information (Table 7).
Table 7: Rows to be entered into Excel Export Manager window
| Object | Parameter | Units | Excel Sheet | Excel Starting Cell | Header | Units |
|---|---|---|---|---|---|---|
| Dead Leg Pipe | Diameter Hydraulic | mm | FIP Calcs | B22 |

|
|
| Main Line In | Diameter Hydraulic | mm | FIP Calcs | D22 |
|
|
| Dead Leg Pipe | Length | meters | FIP Calcs | E22 |
|
|
| Main Line In | Velocity Sonic Outlet | meters/sec | FIP Calcs | F22 |
|
|
| Main Line In | Reynolds Number Outlet | None | FIP Calcs | G22 |
|
|
| Main Line In | Velocity Outlet | meters/sec | FIP Calcs | H22 |
|
|
| Main Line In | Density Static Outlet | kg/m3 | FIP Calcs | I22 |
|
|
-
At the bottom, for Excel Export Location, click the radio button for Previously Saved Workbook.
-
The Flow Induced Vibration Calculation Excel spreadsheet should be preselected. If not, click the Select Workbook button, navigate to the Flow Induced Vibration Calculation.xlsx file then click Open. Rows five through eleven of the Excel Export Manager should match the entries in Figure 8 and the bottom section of Excel Export Manager should look like Figure 9.
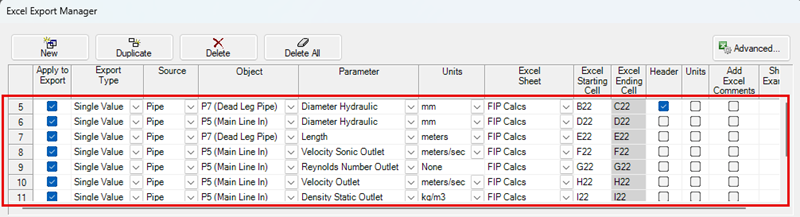
Figure 8: Top of the Excel Export Manager window
Figure 9: Bottom of the Excel Export Manager window with Flow Induced Vibration Calculations Excel spreadsheet selected as Previously Saved Workbook
-
Once all inputs are confirmed to match Figures eight and nine, click Export Now at the bottom left.
Figure 10: Bottom of the Excel Export Manager window
Continue to Step 5. Vibration Analysis Spreadsheet
High Frequency Acoustic Excitation (AIV)
-
The Excel Export Manager window appears. Click the AIV Calcs tab at the bottom of the window if it is not already selected.
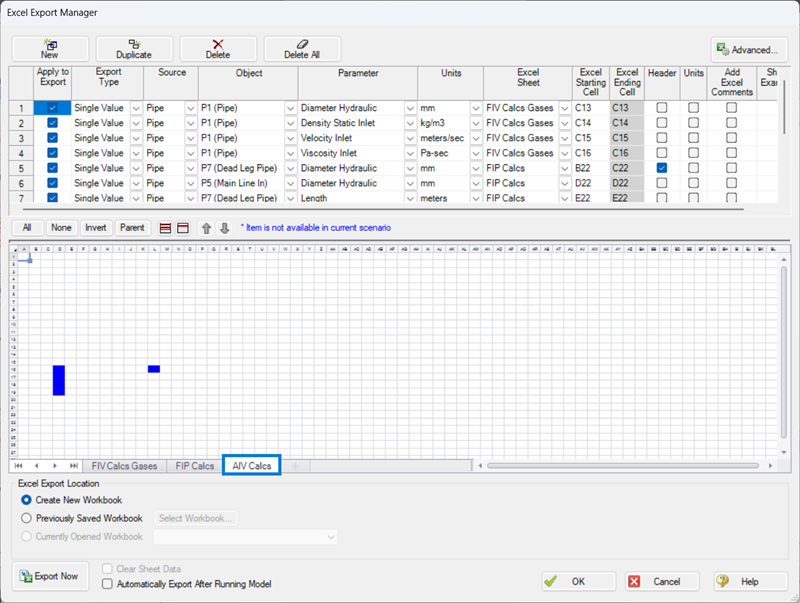
Figure 11: Excel Export Manager window with the AIV Calcs tab selected
-
Note that the final five rows of the Excel Export Manager (rows 12 through 16) have been pre-populated with the following information for the AIV Calcs Excel Sheet (Table 8).
Table 8: Rows to be entered into Excel Export Manager window
| Source | Object | Parameter | Units | Excel Sheet | Excel Starting Cell |
|---|---|---|---|---|---|
| Junction | Bend | Sound Power Level | dB | AIV Calcs | D16 |
| Junction | Area Change | Sound Power Level | dB | AIV Calcs | D17 |
| Junction | Bend | Sound Power Level | dB | AIV Calcs | D18 |
| Junction | Orifice | Sound Power Level | dB | AIV Calcs | D19 |
| Pipe | Main Line In | Diameter Hydraulic | mm | AIV Calcs | L16 |
-
At the bottom, for Excel Export Location, click the radio button for Previously Saved Workbook.
-
The Flow Induced Vibration Calculation Excel spreadsheet should be preselected. If not, click the Select Workbook button, navigate to the Flow Induced Vibration Calculation.xlsx file then click Open. The final five rows of the Excel Export Manager should match the entries in Figure 12 and the bottom section of Excel Export Manager should look like Figure 13.
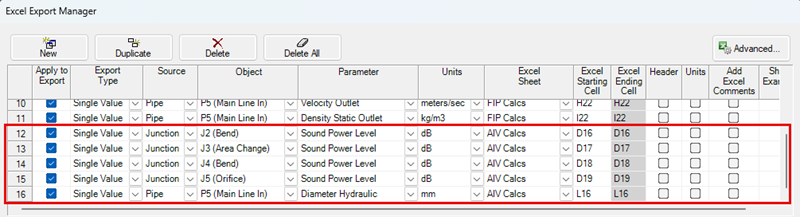
Figure 12: Top of the Excel Export Manager window
Figure 13: Bottom of the Excel Export Manager window with Flow Induced Vibration Calculations Excel spreadsheet selected as Previously Saved Workbook
-
Once all inputs are confirmed to match Figures 12 and 13, click Export Now at the bottom left.
Figure 14: Bottom of the Excel Export Manager window
Continue to Step 5. Vibration Analysis Spreadsheet
Step 5. Vibration Analysis Spreadsheet
AFT Arrow will export the parameters to the spreadsheet which has the prebuilt calculations.
To complete the vibration analysis, use the following instructions for applicable vibration source:
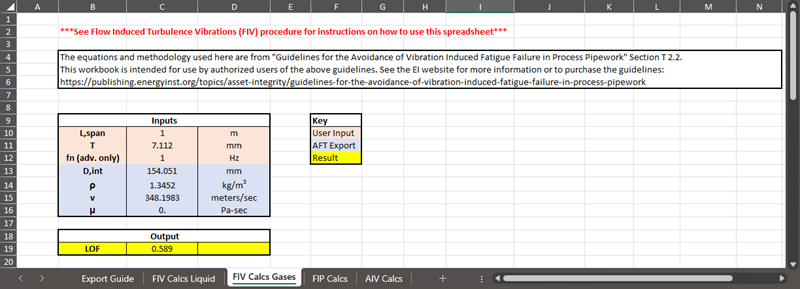
Figure 15: FIV Calcs Gases sheet on Flow Induced Vibration Calculation Excel document
-
Navigate to the FIV Calcs Gases sheet in the Excel workbook.
-
With the values from AFT Arrow, enter the user specified values for the remaining inputs:
-
L,span in m
-
T in mm
-
fn (advanced only)
-
For the highest accuracy, the natural frequency should be measured for the system.
-
If the natural frequency is not known the typical fundamental natural frequency for the system based on the support type is given in Table T2-1 on page 50 of the EI Guidelines and is shown in the spreadsheet in the “Determine Support Arrangement” table in cells F30-F33.
-
-
-
The LOF is calculated and shown in cell C19 in the output section.
-
Use the EI Guidelines to determine appropriate actions based on displayed LOF.
Continue to Conclusion for Flow Induced Vibration
Pulsation: Flow Induced Excitation (FIP)
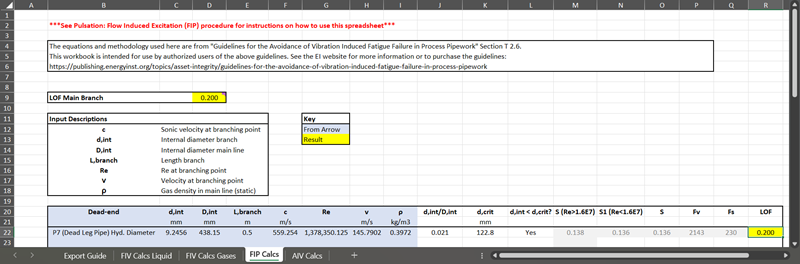
Figure 16: FIP Calcs sheet on Flow Induced Vibration Calculation Excel document
-
Navigate to the FIP Calcs sheet in the Excel workbook.
-
Repeat the steps above for other branches by exporting the values to the next open row.
-
The LOF for each dead end will be calculated and shown in column R.
-
The LOF for the main branch will be equivalent to the highest branch LOF, shown in cell D9.
-
Use the EI Guidelines to determine appropriate actions based on displayed LOF.
Continue to Conclusion for Pulsation: Flow Induced Excitation (FIP)
High Frequency Acoustic Excitation (AIV)
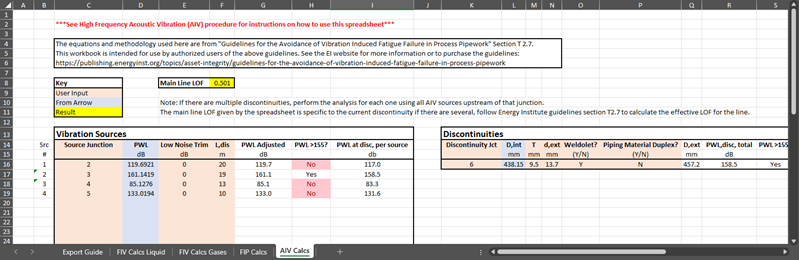
Figure 17: AIV Calcs sheet on Flow Induced Vibration Calculation Excel document
Note: If there are multiple discontinuities, perform the analysis for each one using all AIV sources upstream of that junction. The main line LOF given by the spreadsheet is specific to the current discontinuity if there are several, follow Energy Institute guidelines section T2.7 to calculate the effective LOF for the line.
-
Navigate to the AIV Calcs sheet in the Excel workbook.
-
Note the following values have been prepopulated:
-
Source junction numbers in column C
-
Sound level reduction Low Noise Trim (dB) parameter in column E, if present
-
Length from the vibration source to the discontinuity (L,dis) in column F
-
-
Find the next component in the line:
-
If the next component is an additional vibration source, reexport to the spreadsheet using the Excel Export Manager, but instead of using row 20 for columns C through F, use the next available row.
-
If the next component is a major vessel, then the calculation is finished, check LOF in F8.
-
If the next component is a discontinuity, proceed to next step.
-
-
In the spreadsheet, manually enter the inputs for the discontinuity in columns K and M through P.
-
Cell L16, export (or manually enter) Diameter Hydraulic (D,int) in mm for the main line pipe upstream of the discontinuity.
-
Analysis for this discontinuity is complete and the mainline LOF for this section of piping is shown in the spreadsheet.
-
If there are other discontinuities to analyze, repeat the AIV analysis for each discontinuity. The recommended method is to create copies of the AIV worksheet within the Excel file and to add additional rows to the Excel Export rather than replacing or modifying prior rows. This allows the analysis of each discontinuity to be performed simultaneously if repeating the analysis, e.g. in child scenarios with different flow states.
Continue to Conclusion for High Frequency Acoustic Excitation (AIV)
Conclusion
An LOF of 0.589 indicates a significant risk that the pipe may fail. With an LOF of 0.5 or higher, the following is recommended by the EI Guidelines:
-
The main line should be redesigned, re-supported, or a detailed analysis of the main line should be conducted, or vibration monitoring of the main line should be undertaken.
-
The Small bore connections on the main line should be assessed.
-
Small bore connections on the main line shall be assessed.
-
A visual survey shall be undertaken to check for poor construction and/or geometry and/or support for the main line and/or potential vibration transmission to neighboring pipework.
An LOF of 0.2 indicates a low to moderate risk of failure. With an LOF of 0.3 or lower, the following is recommended by the EI Guidelines:
-
A visual survey should be undertaken to check for poor construction and/or geometry and/or support for the main line and/or potential vibration transmission from other sources.
High Frequency Acoustic Excitation (AIV)
An LOF of 0.501 indicates a significant risk that the pipe may fail. With an LOF of 0.5 or higher, the following is recommended by the EI Guidelines:
-
The main line should be redesigned, re-supported, or a detailed analysis of the main line should be conducted, or vibration monitoring of the main line should be undertaken.
-
The Small bore connections on the main line should be assessed.
-
Small bore connections on the main line shall be assessed.
-
A visual survey shall be undertaken to check for poor construction and/or geometry and/or support for the main line and/or potential vibration transmission to neighboring pipework.


