Quick Access Panel
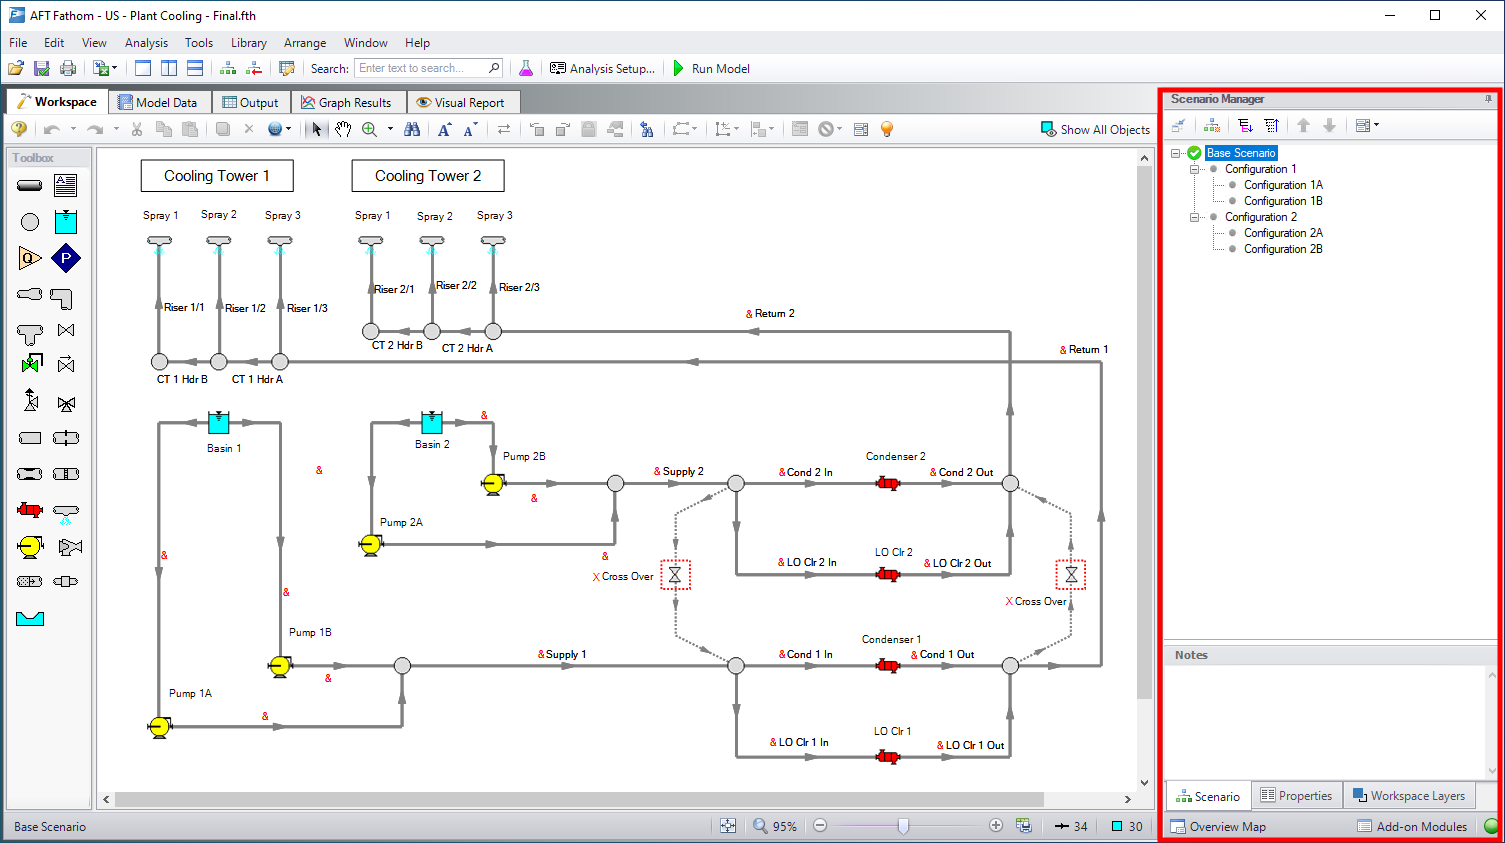
The Quick Access Panel, as shown in Figure 1, contains several useful features:
-
Scenario Manager - Configure the scenarios and variations of the model
-
Properties tab - Review pipe/junction inputs or output, and edit annotations
-
Workspace Layers - Superimpose input and output parameters on top of the Workspace model
-
Overview Map - Easily navigate large models
-
Activate Add-on Modules - Shortcut to the Add-on Modules group in the Analysis Setup
-
Model Status Light - Green/red light indicating if all required input is present and if the Solver is ready to run
By clicking on the Scenario tab in Figure 2 below, you have the full scenario customization ability as you would with the Scenario Manager. You can create child scenarios, expand or collapse various families of scenarios, and use the many other Scenario Manager features here as well.
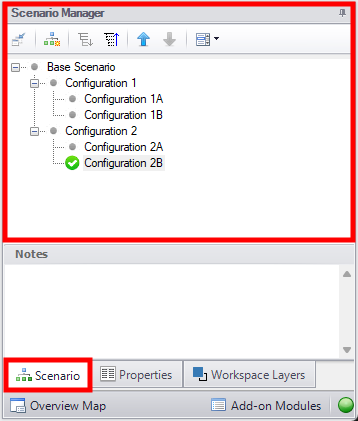
Figure 2: The Scenario Manager
As seen in Figure 1 or 2, there is a "Properties" tab in the Quick Access Panel. When pipes and junctions are drawn on the Workspace, you can quickly view the Pipe or Junction Properties by first selecting a pipe or junction on the Workspace, then clicking on the "Properties" tab. The tab's name will dynamically update depending on which pipe/junction is selected. This will display the Object Property data as well as any Output data if the model has been run. Figure 3 below shows an example of what the Properties tab would look like when clicking on a pipe on the Workspace after it has been defined and output was created.
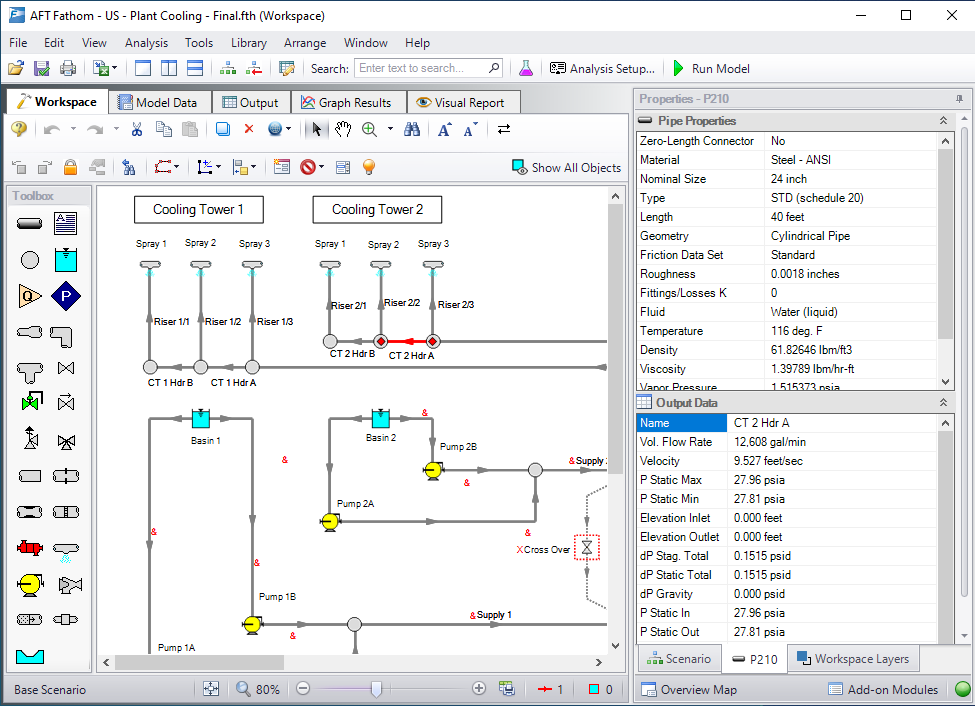
Figure 3: Viewing the Pipe/Junction Properties and Output Data from the Quick Access Panel
Annotations can be edited by selecting an annotation on the Workspace which will bring up their properties in this tab where they can then be edited.
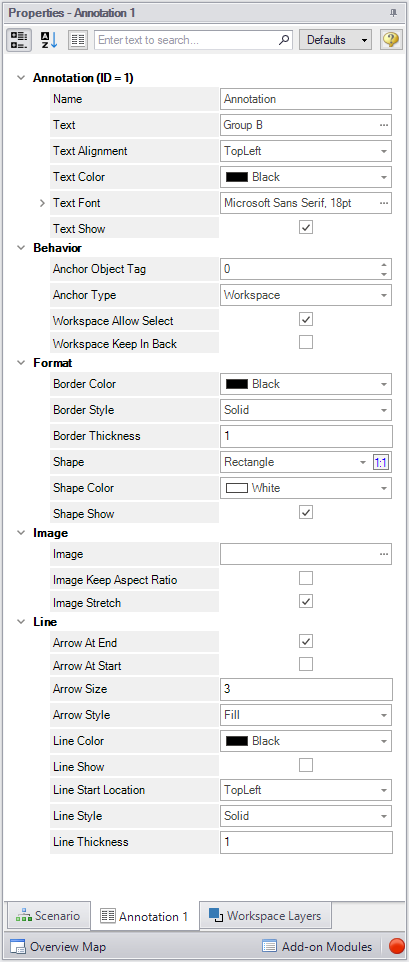
Figure 4: Annotation view for the Properties in the Quick Access Panel
The Workspace Layers tab contains settings relating to object visibility, labels, superimposing input/output data, and color maps.
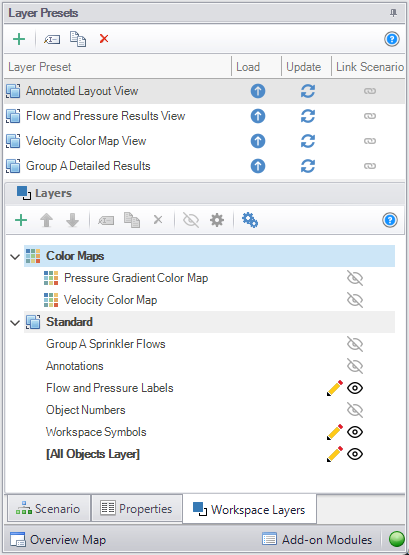
Figure 5: View of the Workspace Layers panel structure
When a model is very large in size, it can be troublesome to have to constantly drag the model around on the Workspace to get to a specific area of the model you want to view. By clicking on the Workspace Overview Map button in the red box in Figure 6, you will bring up a map that is a bird's eye view of the model. Drag the small square in the Workspace Overview Map over various parts of the model, then zoom in and out of the model. You can also click the "Fit" button to see the full model zoomed out on the Workspace. You can also zoom in and out using the mouse wheel.
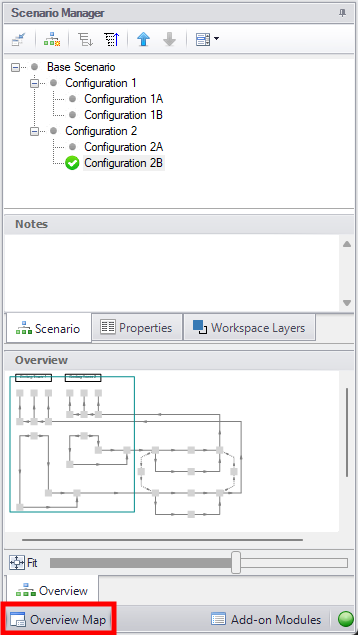
Figure 6: Workspace Overview Map
Clicking the Modules button in the bottom right of the Quick Access Panel in Figure 7 launches Analysis Setup to the Modules panel to activate or deactivate add-on modules.
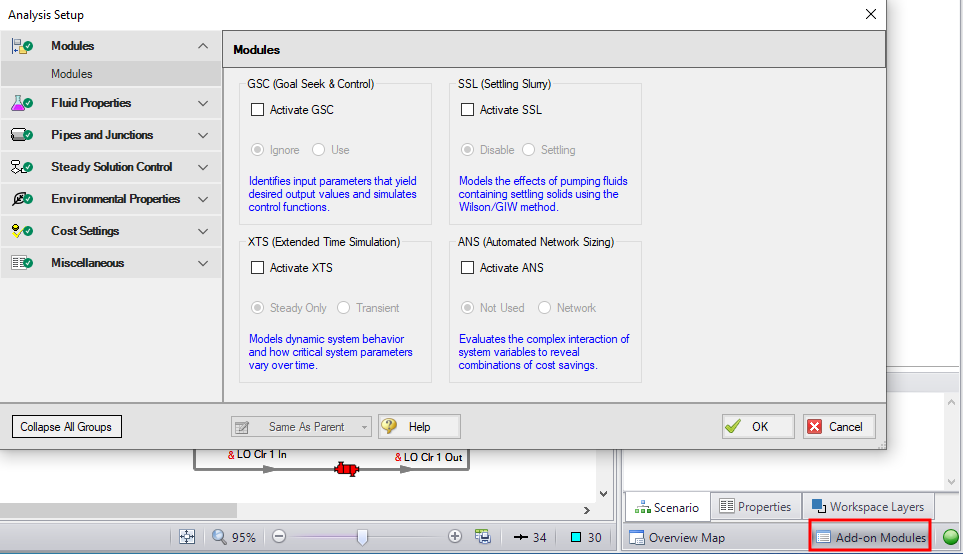
Figure 7: Activating the Modules from the Quick Access Panel
The Model Status Light is located in the bottom-right of the Quick Access Panel (Figure 8). Clicking the Status Light will open Analysis Setup. When each item in Analysis Setup is fully defined, it will have a green check mark. When all necessary items in Analysis Setup are completed, the Status Light will turn from red to green, indicating that the model can be run.
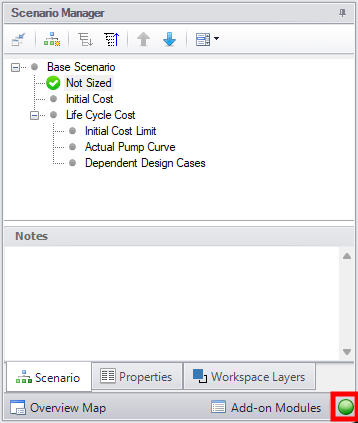
Figure 8: The Model Status Light is located at the bottom-right of the Quick Access Panel
Minimizing the Quick Access Panel
By default, AFT Fathom opens with the Quick Access Panel automatically expanded. The Quick Access Panel can be easily collapsed and pinned to the side of the Workspace to allow for a larger usage area of the Workspace. Figure 9 shows the AFT Fathom window with the Quick Access Panel initially expanded. By clicking on the thumbtack pin button (highlighted below with the red box), the Quick Access Panel will then become collapsed as shown in Figure 10. After the Quick Access Panel is collapsed, it can be temporarily expanded again simply by hovering over the "Scenario" sidebar with the mouse.
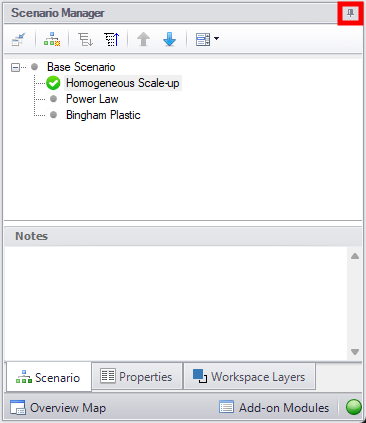
Figure 9: The Workspace with the Quick Access Panel expanded
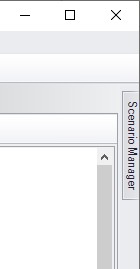
Figure 10: The Workspace with the Quick Access Panel collapsed


