Flow Induced Vibration Calculations (Metric Only)
Summary
Repeated vibration on a piping system can result in vibration induced fatigue and failure. Pipe failure due to vibration creates safety concerns for personnel and environmental contamination, as well as costly downtime and repairs. Despite these concerns, vibration sources and resulting fatigue are often not addressed by design standards. Instead, designers and operators often react to vibration issues rather than prevent and avoid these issues proactively.
In response to vibration concerns, the Energy Institute developed the Guidelines for the Avoidance of Vibration Induced Fatigue Failure in Process PipeworkEnergy Institute, Guidelines for the Avoidance of Vibration Induced Fatigue Failure in Process Pipework, 2nd Edition, Energy Institute, London, UK, 2008. [Online]. Available: https://publishing.energyinst.org/topics/asset-integrity/guidelines-for-the-avoidance-of-vibration-induced-fatigue-failure-in-process-pipework.. These guidelines provide sources of vibration for engineers to consider, many of which can be identified or modeled in an AFT application as found in the Table 1 below.
Table 1: Vibration sources and applicable AFT Application
| Vibration Sources | AFT Application | |
|---|---|---|
| Surge | Sudden changes to flow/pressure | AFT Impulse / AFT xStream |
| Cavitation | Vapor formation and collapse | AFT Fathom / AFT Impulse |
| Reciprocating Equipment | Identify resonant frequencies to avoid during operation | AFT Impulse PFA Module / AFT xStream PFA Module |
| FIV | Turbulence from flow discontinuities | AFT Fathom / AFT Arrow |
| AIV | High frequency acoustic energy | AFT Arrow |
| FIP | Excitation at dead end branches | AFT Arrow |
These guidelines provide a structured approach to identify, assess, and correct vibration concerns through qualitative and quantitative methods. AFT has developed a Flow Induced Vibration Calculations spreadsheet which, in conjunction with model output and user input, can perform key parts of the recommended quantitative assessment of different vibration sources. These calculations used with the Energy Institute guidelines will help engineers identify vibration concerns in their systems.
In this example, learn how to use AFT Fathom to help calculate the Likelihood of Failure (LOF) for Flow Induced Vibration (FIV) in accordance with Energy Institute Guidelines to avoid vibration induced fatigue failure.
Topics Covered
-
The cause and concerns of Flow Induced Vibration (FIV):
-
Occurs in both compressible and incompressible flow
-
Excitation caused by turbulence from discontinuities or boundary layer separation
-
Generally concentrated at low frequencies (<100 Hz)
-
Can lead to visible vibrations of piping and supports
-
-
Required calculation parameters for FIV
-
Excel Export Manager
-
Use of AFT vibration analysis spreadsheet
Required Knowledge
This example assumes the user has already worked through the Beginner - Three Reservoir example, or has a level of knowledge consistent with that topic. You can also watch the Fathom Quick Start Video Tutorial Series, as it covers the majority of the topics discussed in the Three-Reservoir Problem example.
Model Files
This example uses the following files, which are installed in the Examples folder as part of the AFT Fathom installation:
Problem Statement
Turbulence is common in most practical piping systems. In this example, we will examine turbulence in straight pipes, caused by the boundary layer at the pipe wall, with its intensity depending on the flow regime, characterized by the Reynolds number. However, in typical scenarios, major flow disturbances like process equipment, partially closed valves, sharp bends, tees, and reducers are the primary sources of turbulence.
Reference: Pages 48-53, Section T2.2, Flowchart T2-1
Purpose: Looking at the part of the mainline with most turbulence and the greatest distance between supports to determine the LOF
Input Values/Sources/Descriptions:
Note: Table 2 shows the specific values used in this model, but the steps in this Example can be used to calculate the LOF for vibration concerns in any model.
Table 2: Input Values/Sources/Descriptions
| Object | Inputs | Example Value | Source | Description |
|---|---|---|---|---|
| P4 (Pipe) | L,span | 7 m | User Input | Max span length between supports |
| P4 (Pipe) | T | 9.525 mm | User Input | Thickness of pipe wall |
| P4 (Pipe) | fn (adv. only) | 1 Hz | User Input | Structural natural frequencies |
| P4 (Pipe) | D,int | 438.15 mm | AFT Export | Internal pipe diameter |
| P4 (Pipe) | ρ | 998.9342 kg/m3 | AFT Export | Fluid density (static) |
| P4 (Pipe) | v | 4.0503 m/s | AFT Export | Fluid velocity |
Note: L,span of 7 m assumes that supports are at the elbows and the pressure boundaries for the example model.
Step 1. Start AFT Fathom
From the Start Menu choose the AFT Fathom 13 folder and select AFT Fathom 13.
To ensure that your results are the same as those presented in this documentation, this example should be run using all default AFT Fathom settings, unless you are specifically instructed to do otherwise.
Step 2. Open the Model
Open the Metric - Flow Induced Vibration Calculations.fth model file.
The workspace should look like Figure 1 below.
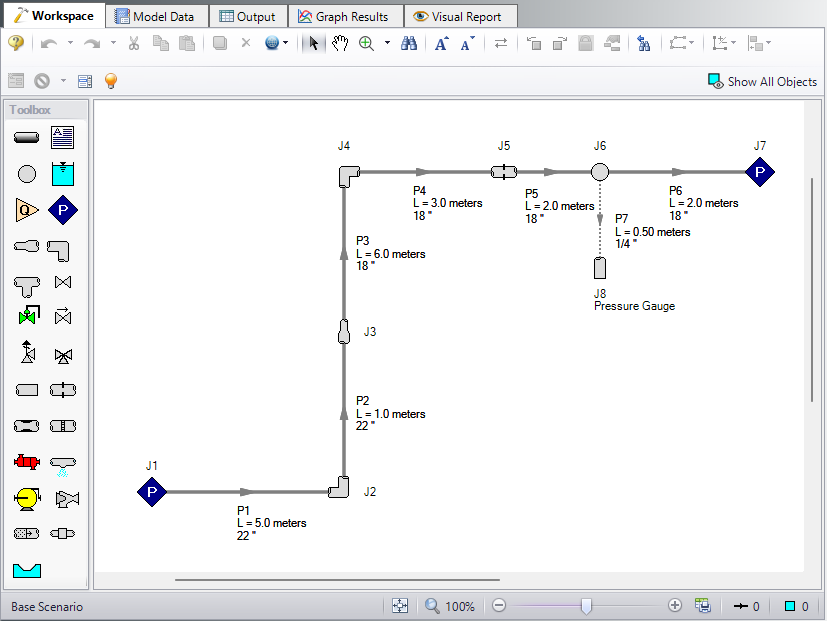
Figure 1: Layout of FIV Analysis Model on the Workspace
Step 3. Run the Model
Click Run Model on the toolbar or from the Analysis menu. This will open the Solution Progress window. This window allows you to watch as the AFT Fathom solver converges on the answer. Now view the results by clicking the Output button at the bottom of the Solution Progress window.
Step 4. Excel Export Manager
-
From the Workspace, click the Excel Export Manager button on the toolbar, then click Open.
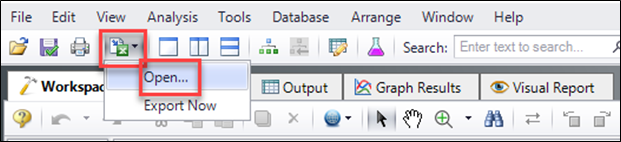
Figure 2: Opening Excel Export Manager from the Workspace
-
The Excel Export Manager window appears.
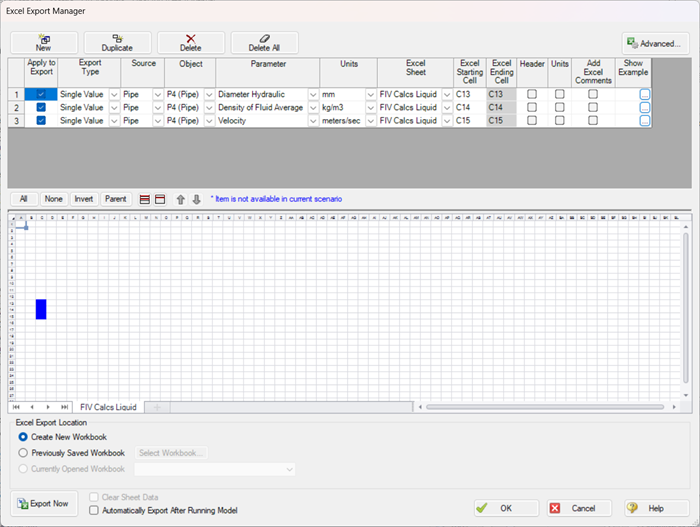
Figure 3: Excel Export Manager window
Note that three rows have been added to the Excel Export Manager with the following information. P# (Pipe) is the same pipe for all rows.
Table 3: Excel Export Manager parameters for FIV calculations
| Object | Parameter | Units | Excel Sheet | Excel Starting Cell | Header | Units |
|---|---|---|---|---|---|---|
| P# (Pipe) | Diameter Hydraulic | mm | FIV Calcs Liquid | C13 |

|
|
| P# (Pipe) | Density of Fluid Average | kg/m3 | FIV Calcs Liquid | C14 |
|
|
| P# (Pipe) | Velocity | meters/sec | FIV Calcs Liquid | C15 |
|
|
-
At the bottom, for Excel Export Location, click the radio button for Previously Saved Workbook.
-
The Flow Induced Vibration Calculation Excel spreadsheet should be preselected. If not, click the Select Workbook button, navigate to the Flow Induced Vibration Calculation.xlsx file then click Open. The top of the Excel Export Manager window should look like Figure 4 and the bottom should look like Figure 5.
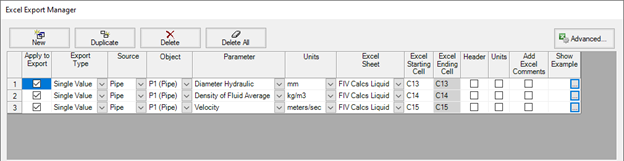
Figure 4: Excel Export Manager window with incompressible fluids
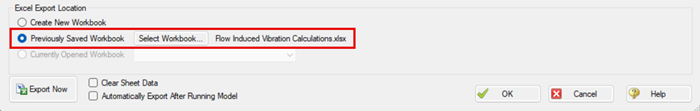
Figure 5: Bottom of the Excel Export Manager window
-
Once all inputs are confirmed to match the above window, click Export Now at the bottom left.
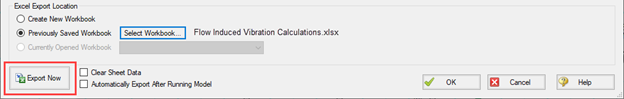
Figure 6: Bottom of the Excel Export Manager window
Step 5. Vibration Analysis Spreadsheet
AFT Fathom will export the parameters to the spreadsheet which has the prebuilt calculations.
To complete the vibration analysis, use the following instructions:
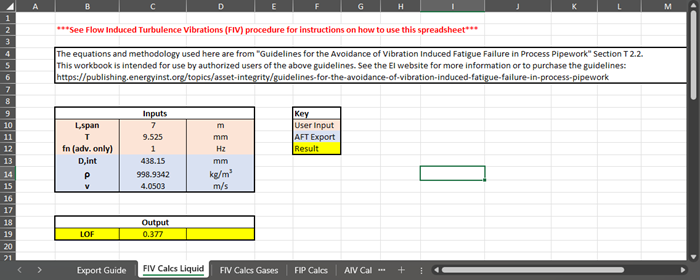
Figure 7: Flow Induced Vibration Calculations Excel document following export
-
Navigate to the FIV Calcs Liquid sheet in the Excel workbook.
-
With the values from AFT Fathom, note the user specified values for the remaining inputs:
-
L,span in m
-
T in mm
-
fn (advanced only)
-
For the highest accuracy, the natural frequency should be measured for the system.
-
If the natural frequency is not known the typical fundamental natural frequency for the system based on the support type is given in Table T2-1 on page 50 of the EI Guidelines and is shown in the spreadsheet in the “Determining Support Type” table in cells F28-F31.
-
-
-
The LOF is calculated and shown in cell C19 in the output section.
-
Use the EI Guidelines to determine appropriate actions based on displayed LOF.
Conclusion
An LOF of 0.377 indicates a moderate risk that the pipe may fail, but does not necessarily require a full redesign of the main line. When failure is not imminent (LOF < 0.5), the following is recommended by the EI Guidelines:
-
Small bore connections on the main line should be assessed.
-
A visual survey should be undertaken to check for poor construction and/or potential vibration transmission from other sources.


