Basic Graph Tutorial
Graphs are powerful analysis tools. AFT Fathom has special tools to create and save Graphs and regenerate them later even if the output data has changed due to model changes. Follow the tutorial below to make and manage graphs from one of the example models.
Create and run a fully defined model. This tutorial uses the Sizing a Pump example model, available in the standard installation of AFT Fathom.
To skip to different sections of this tutorial, use the links below:
Pump vs. System Curves
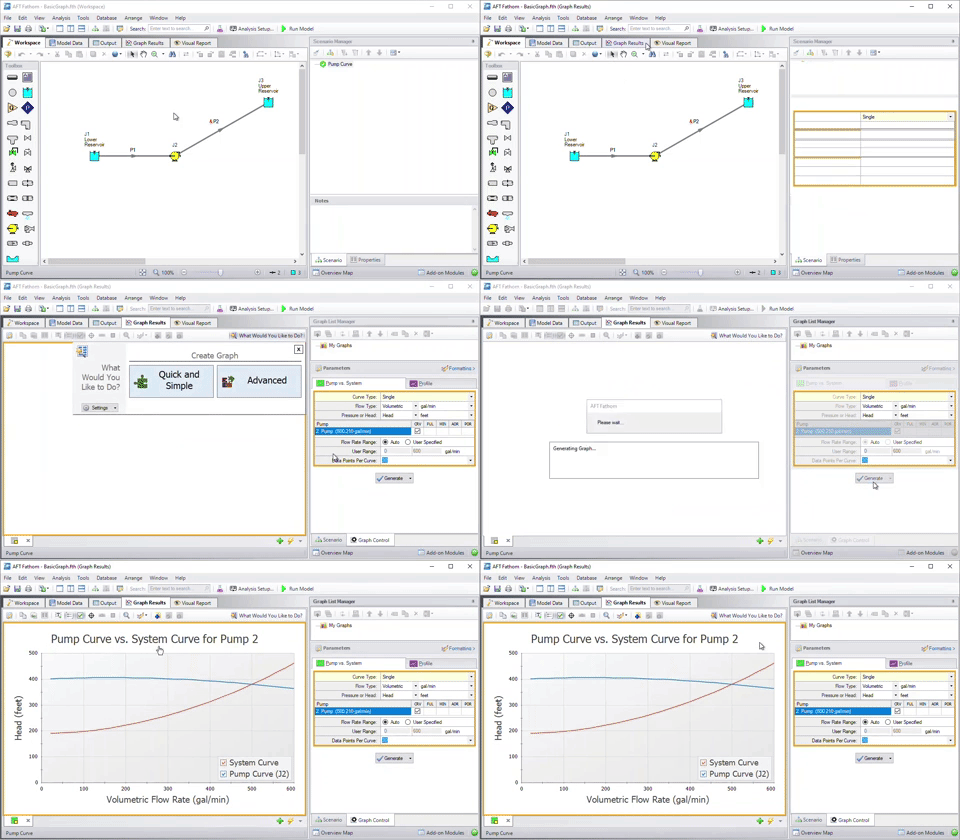
| Using a model with output, navigate to the Graph Results window. On the right in the Quick Access Panel, select the Pump vs. System tab and select the desired parameters (for the example, the defaults have not been altered) in the Parameters area. After the parameters have been selected, click Generate, and the graph will appear on the left. |
|
Profile Graphs
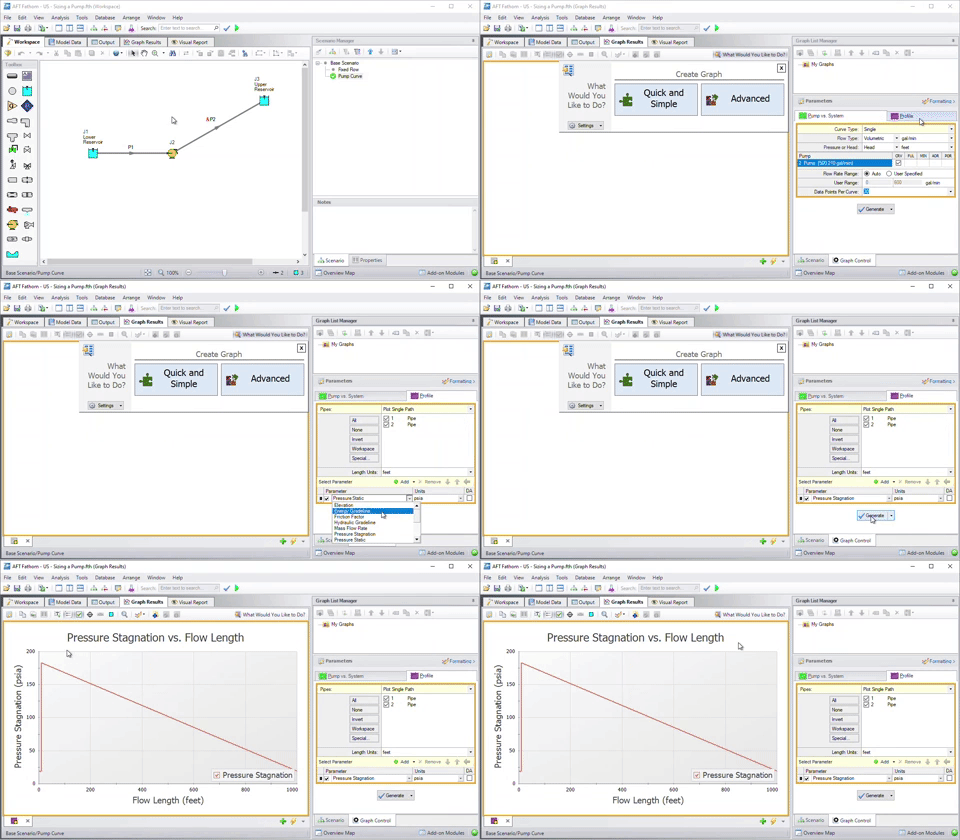
| Using a model with output, navigate to the Graph Results window. On the right in the Quick Access Panel, click the Profile tab. This graph type displays the selected parameter along the length of the flow path. Select both pipes in the system and change the parameter to Pressure Stagnation. Using the default units of feet for length and psia for pressure, click Generate and the graph will appear on the left. |
|
Saving Graphs
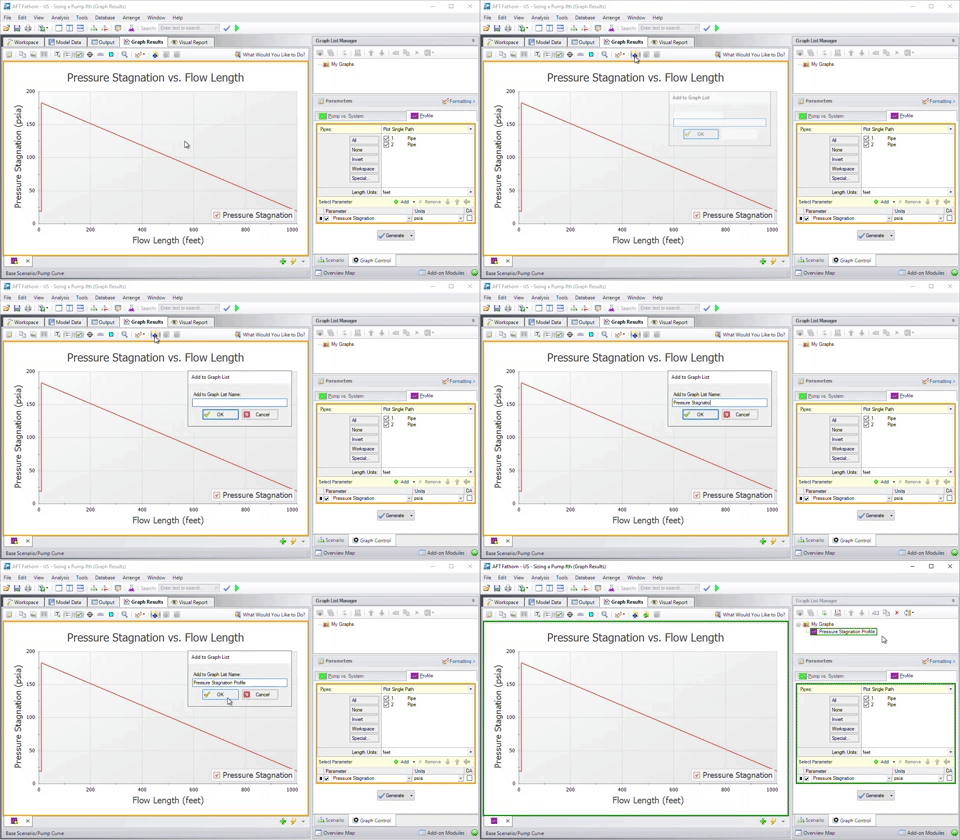
| After generating a graph, save the graph by selecting the Add Graph To List shortcut on the Graph Results Toolbar. Give the graph a name and it will appear under My Graphs in the Graph List Manager on the right. Easily regenerate this graph with the same parameters and format if the output changes by double-clicking on the graph name. The border of the Graph has also changed to dark green along with borders of the parameters and the name of the Graph in the Graph List Manager. This indicates that that Graph is current, saved, and that the displayed parameters are the ones used to generate the Graph. |
|
Creating Multiple Graphs
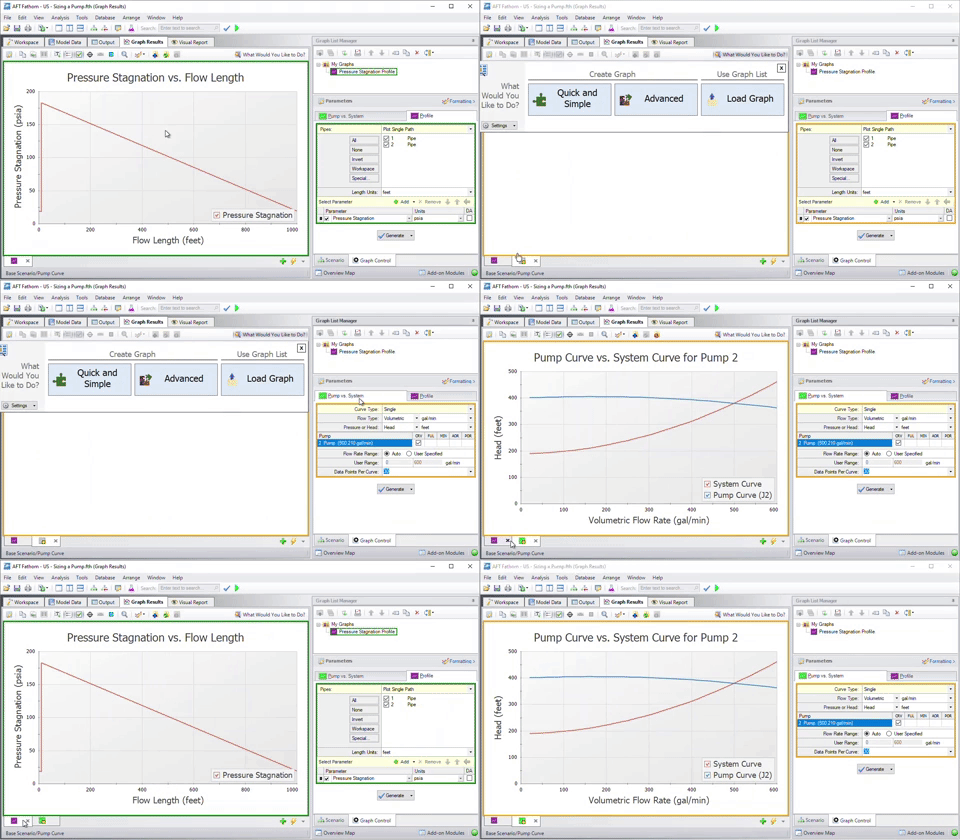
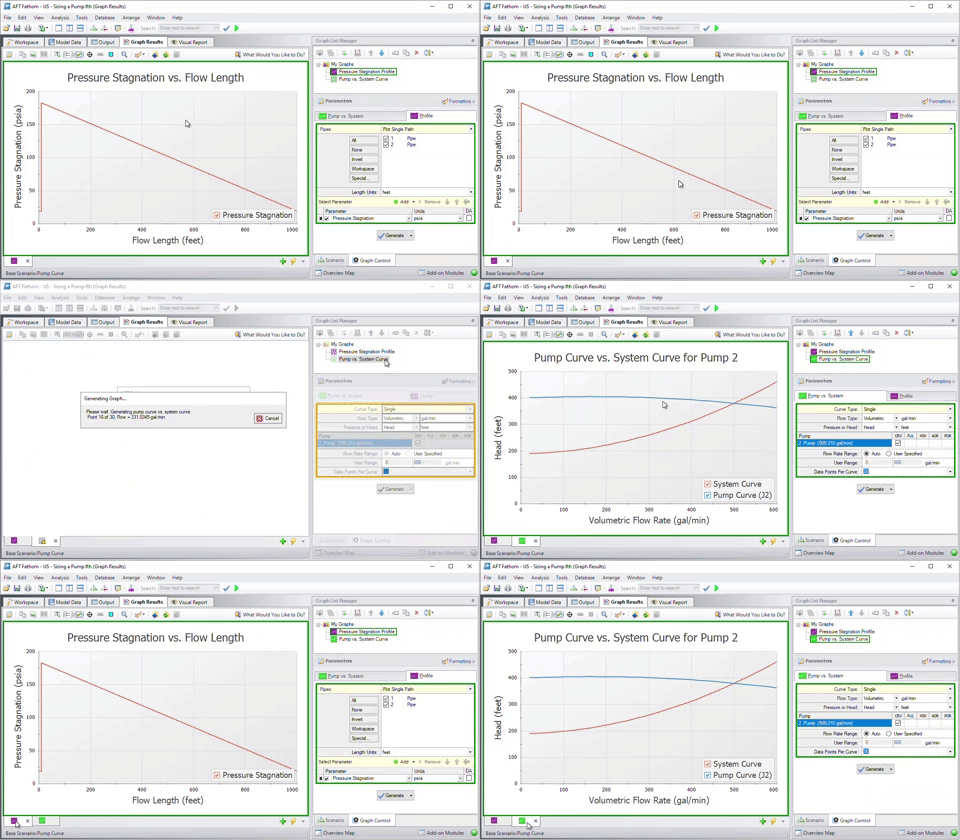
| Create multiple graphs stored on their own tabs by first clicking on the green plus button on the bottom right of the graph window to create a new graph tab. This creates a new graph tab. Generate a graph and then toggle between the graphs by selecting the tabs on the bottom of the graph window. Add as many graphs as desired. |
|
| Alternatively, double-click a saved graph in the Graph List Manager in the Quick Access Panel to automatically generate that graph on a new tab. |
|
Displaying Multiple Graphs Simultaneously
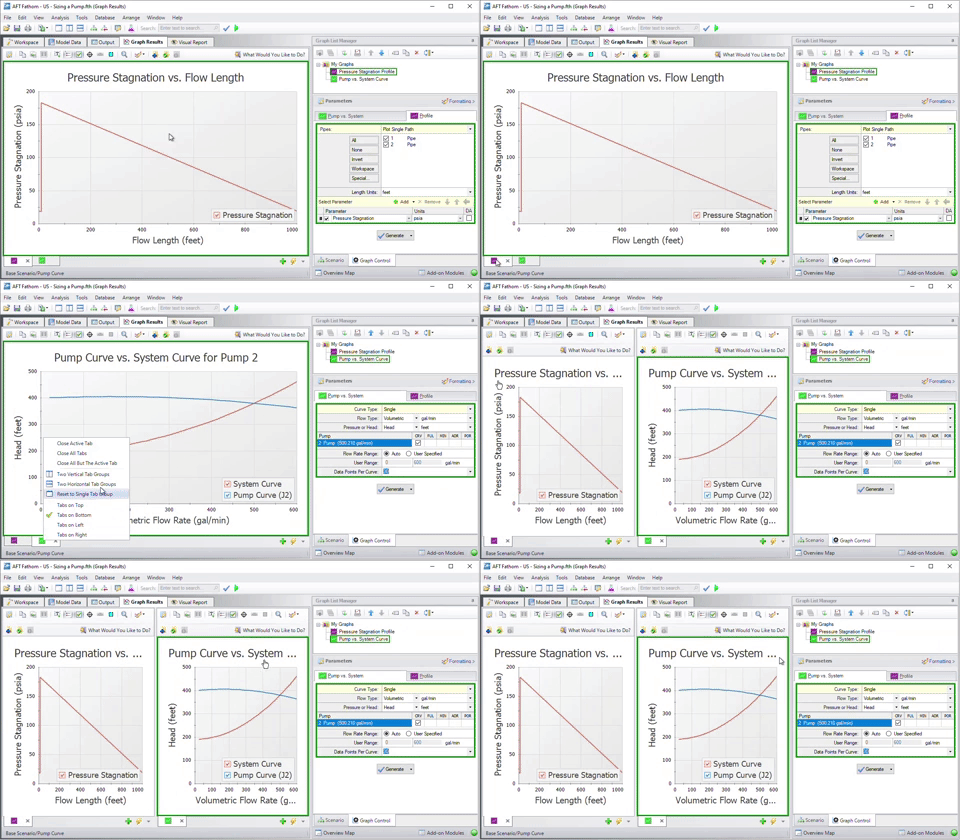
| To view multiple graphs in the same window, right click on a graph tab and select either Two Vertical Tab Groups or Two Horizontal Tab Groups. The graphs will then display next to each other such that both graphs can be viewed simultaneously. |
|
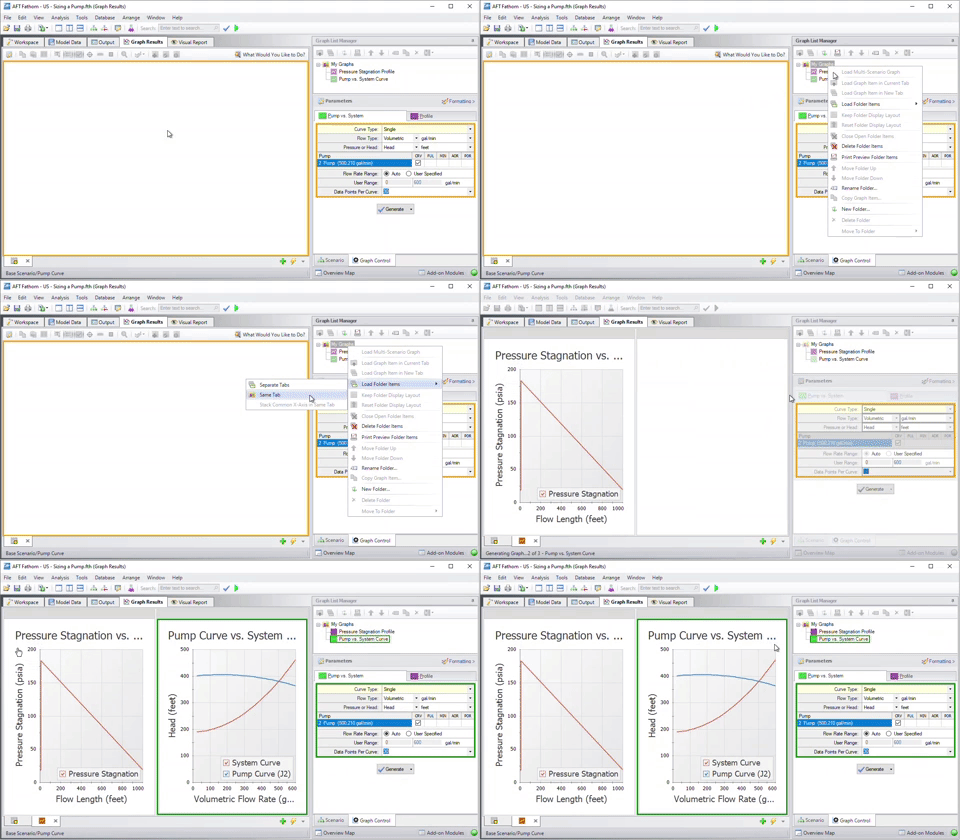
| Alternatively, right-click on the My Graphs folder in the Graph List Manager, choose Load Folder Items, then click Same Tab. This will generate all graphs in the My Graphs folder into the same tab (as opposed to displaying multiple tabs simultaneously as described previously). |
|
Creating Graphs from the Workspace
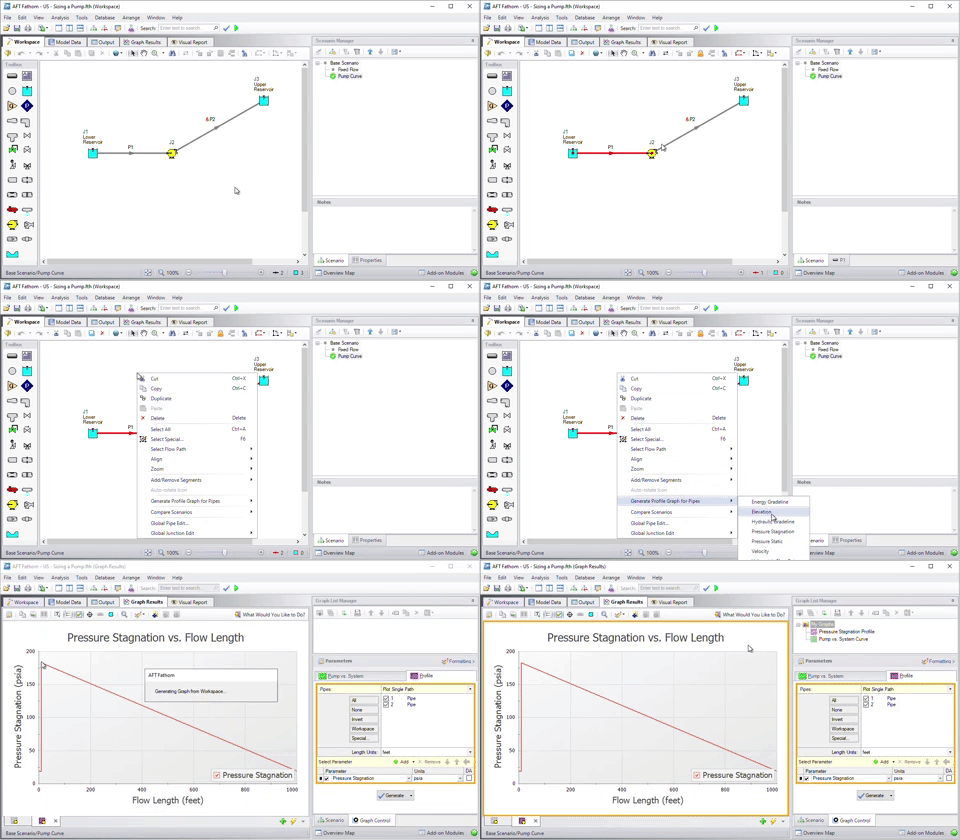
| Some graphs can also be generated directly from the Workspace after running the model. Generate the Pressure Stagnation vs. Flow Length graph from the Workspace by selecting the flow path on the Workspace (note that you can select multiple pipes by holding the SHIFT button on the keyboard while selecting each pipe). Right click on the Workspace, choose the Generate Profile Graph for Pipes option, then click Pressure Stagnation. |
|


