SSL in Graph Results
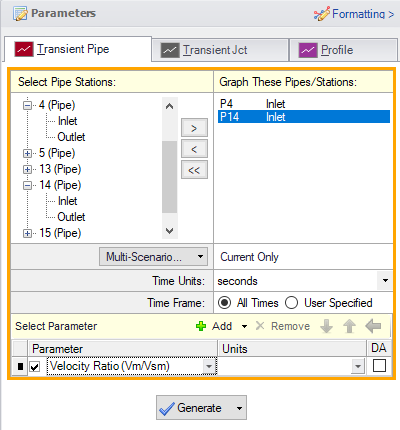
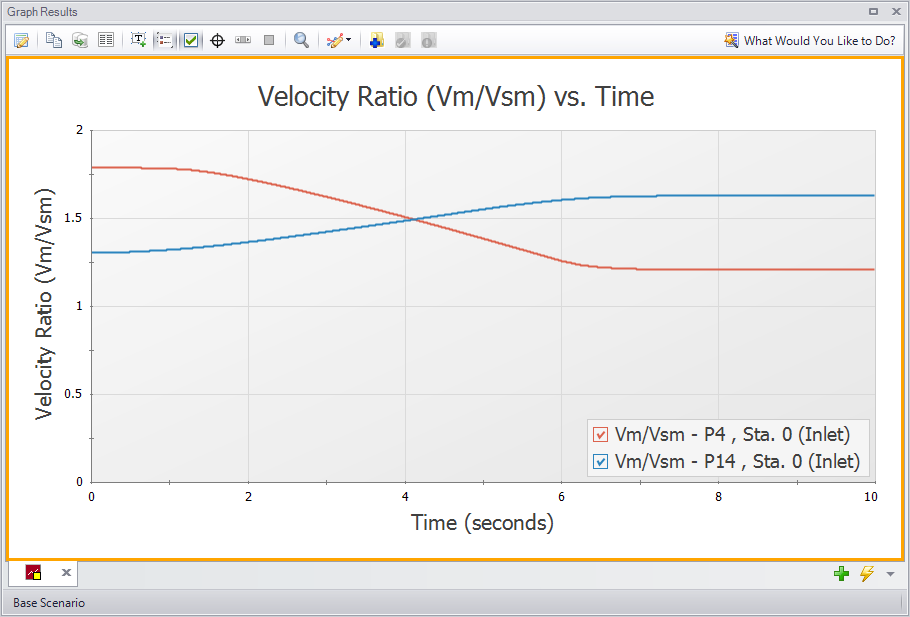
(SSL Module Only) The transient slurry parameters are shown along side the regular pipe transient parameters in the Graph Control tab on the Quick Access panel (Figure 1). The resulting graph of the velocity ratio is shown in Figure 2.

Figure 1: Transient slurry parameters are selected on the Quick Access panel

Figure 2: Graph Results window showing the Velocity Ratio over time for selected locations when using the SSL module.
Related Topics
Related Examples


