Diagnostics Window
The Model Diagnostics Window is intended to help users check on a number of settings that may have been changed during the model-building process and that may affect the model results.
The Model Diagnostics window can be accessed from the Tools menu.
When the Model Diagnostics Window is opened all input will be checked, and the results will be displayed in a tabular format. Items of note will be highlighted based on the impact each identified item may have on the results. It should be noted that not all items identified by this window will have a negative impact on results. Rather, the identified items are settings that have frequently been incorrectly applied by other users. This is not an exhaustive list of troubleshooting items, though the most common issues are all included.
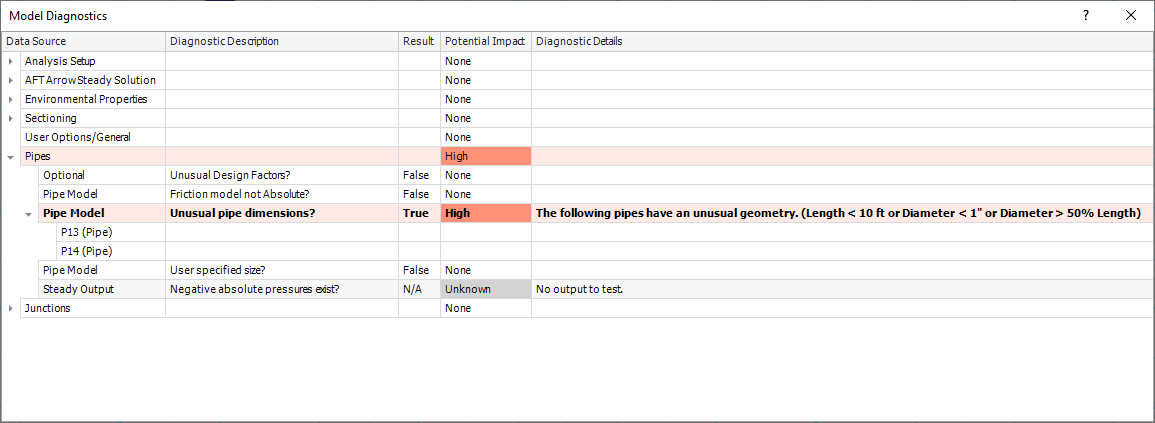
Data in the Model Diagnostics is organized by the Data Source, which is the window where that setting/input is defined. Any item that may negatively impact the model will be highlighted based on its potential to affect the model, as shown in the Potential Impact column. For pipe and junction diagnostic items, the pipe(s)/junction(s) that were identified will be listed below the diagnostic item. For an example, see Figure 1 below. The Diagnostic window indicates that multiple pipes have unusual pipe dimensions, and should be reviewed.

Figure 1: Example of the Model Diagnostics window. For this example, potential issues have been flagged in the pipe dimensions.
Related Blogs


