Pipe Sizing for Sand Transfer - SSL (English Units)
Pipe Sizing for Sand Transfer - SSL (Metric Units)
Summary
Sand is being transferred from a quarry sand pit and being transferred to receiving deposits in two different locations. There are two valves that control the flow to each of these deposits by changing their opening position (modeled as Cv). The ratio of the mixture velocity to the velocity at which the sand will settle out of the liquid and form a stationary bed on the bottom of the pipe (Vsm) must be kept above 1.2 to avoid potentially plugging the pipe. Determine if the pipe size and velocity ratio is acceptable during the transient where one valve starts to close while the other opens further.
Note: This example can only be run if you have a license of the SSL module.
Topics Covered
-
Entering solids data
-
Reviewing calculated slurry output
-
Using Design Alerts
Required Knowledge
This example assumes the user has already worked through the Walk-Through Examples section, and has a level of knowledge consistent with the topics covered there. If this is not the case, please review the Walk-Through Examples, beginning with the Beginner: Valve Closure example. You can also watch the AFT Impulse Quick Start Video (English Units) on the AFT website, as it covers the majority of the topics discussed in the Valve Closure example.
Model File
This example uses the following file, which is installed in the Examples folder as part of the AFT Impulse installation:
Step 1. Start AFT Impulse
From the Start Menu choose the AFT Impulse 9 folder and select AFT Impulse 9.
To ensure that your results are the same as those presented in this documentation, this example should be run using all default AFT Impulse settings, unless you are specifically instructed to do otherwise.
Step 2. Define the Modules Group
First the SSL add-on modules needs to be activated for use in the model. To do this, open Analysis Setup from the toolbar or Analysis menu. On the Modules panel, check the box next to Activate SSL. After the SSL module is activated, the Settling option should being selected by default.
Step 3. Define the Fluid Properties Group
-
Carrier Fluid panel (Figure 1)
-
Carrier Fluid = Basic (Water)
-
Temperature = 70 deg. F
-
-
Solids Definition panel (Figure 2)
-
Slurry Calculation Method = Detailed
-
Solids Specifications = User Specified Solids Added
-
M (Stratification Ratio Exponent) = Calculated
-
Terminal Velocity Parameter = Vt / Vts (Xi)
-
Value = 0.55
-
Density = 2.65 S.G. water
-
d50 = 0.0275 inches
-
d85 = 0.04 inches
-
Bulk Modulus = 2.32e6 psia
-
-
Slurry Definition panel (Figure 3)
-
Concentration Type = Volume Fraction
-
Amount Solids Added = 20 Percent
-
Slurry Model = Settling Slurry - Wilson, Addie, Clift
-
Step 4. Define the Pipes and Junctions Group
At this point, the first two groups are completed in Analysis Setup. The next undefined group is the Pipes and Junctions group. To define this group, the model needs to be assembled with all pipes and junctions fully defined. Click OK to save and exit Analysis Setup then assemble the model as shown in the figure below.
![]()
Figure 4: Layout of pipe system for Sand Transfer to Two Locations example
The system is in place but now we need to enter the input data for the pipes and junctions. Double-click each pipe and junction and enter the following data in the properties window.
Pipe Properties
-
Pipe Model tab
-
Pipe Material = Steel - ANSI
-
Size = 10 inch
-
Type = STD (schedule 40)
-
Friction Model Data Set = Standard
-
Length = Use table below
-
Wavespeed = Calculated Wavespeed
-
| Pipe | Length (feet) |
|---|---|
| 1 | 10 |
| 2 | 400 |
| 3 | 5 |
| 4 | 85 |
| 5 | 400 |
| 13 | 5 |
| 14 | 100 |
| 15 | 700 |
Junction Properties
-
Reservoir J1
-
Name = Sand Pit
-
Tank Model = Infinite Reservoir
-
Liquid Surface Elevation = 0 feet
-
Liquid Surface Pressure = 0 psig
-
Pipe Depth = 0 feet
-
-
Pump J2
-
Name = Main Slurry Pump
-
Inlet Elevation = 4 feet
-
Pump Model = Centrifugal (Rotodynamic)
-
Performance Curve Used in Simulation = Standard Pump Curve
-
Enter Curve Data =
-
| Volumetric | Head | Power |
|---|---|---|
| gal/min | feet | hp |
| 0 | 500 | 1025 |
| 4000 | 475 | 1100 |
| 7000 | 400 | 1200 |
| 9000 | 300 | 1350 |
-
Curve Fit Order = 2
-
Branch J3
-
Elevation = 4 feet
-
-
Valve J4
-
Name = Valve to Deposit #1
-
Inlet Elevation = 4 feet
-
Loss Model tab
-
Valve Data Source = User Specified
-
Loss Model = Cv
-
Loss Source = Fixed Cv
-
Cv = 500
-
-
Transient tab
-
Transient Special Condition = None
-
Initiation of Transient = Time
-
Transient Data = Absolute Values
-
-
| Time (seconds) | Cv |
|---|---|
| 0 | 500 |
| 1 | 500 |
| 6 | 300 |
| 10 | 300 |
-
Branch J5
-
Elevation = 20 feet
-
-
Reservoir J6
-
Name = Deposit #1
-
Tank Model = Infinite Reservoir
-
Liquid Surface Elevation = 20 feet
-
Liquid Surface pressure = 0 psig
-
Pipe Depth = 0 feet
-
-
Valve J7
-
Name = Valve to Deposit #2
-
Inlet Elevation = 4 feet
-
Loss Model tab
-
Loss Model = Cv
-
Loss Source = Fixed Cv
-
Cv = 400
-
-
Transient tab
-
Transient Special Condition = None
-
Initiation of Transient = Time
-
Transient Data = Absolute Values
-
-
| Time (seconds) | Cv |
|---|---|
| 0 | 400 |
| 5 | 500 |
| 10 | 500 |
-
Branch J8
-
Elevation = 30 feet
-
-
Reservoir J9
-
Name = Deposit #2
-
Tank Model = Infinite Reservoir
-
Liquid Surface Elevation = 30 feet
-
Liquid Surface pressure = 0 psig
-
Pipe Depth = 0 feet
-
Design Alerts
In this system the Velocity Ratio (mixture to settling velocity ratio or Vm/Vsm) must remain greater than 1.2 in each of the pipes to avoid the potential of the sand falling out of the slurry and plugging the pipe. Use the Design Alert Manager to add a Design Alert to each pipe. This will give a warning message in the output if the velocity ratio is below the minimum value.
-
Fro m the Tools menu, select Design Alerts to open the Design Alert Manager.
-
Click Create New Design Alert.
-
Name = Min Velocity Ratio (Vm/Vsm)
-
Object Type = Pipes
-
Parameters = Velocity Ratio (Vm/Vsm)
-
Selection = Minimum
-
Value = 1.2
-
Click Add to List
-
Click Update/Add Design Alert
-
Select the new design alert in the Existing Design Alerts list, then click All below the Pipes in Design Alert area to apply the Design Alert to all pipes in the model.
-
The Design Alert Manager window should now appear as shown in Figure 5.
-
Click OK to return to the Workspace.
Open the Pipe Properties window of any pipe and click the Design Alerts tab. Check to confirm that the Design Alert that you created has been applied (Figure 6).
ØTurn on the Show Object Status from the View menu to verify if all data is entered. If so, the Pipes and Junctions group in Analysis Setup will have a check mark. If not, the uncompleted pipes or junctions will have their number shown in red. If this happens, go back to the uncompleted pipes or junctions and enter the missing data.
Step 5. Define the Pipe Sectioning and Output Group
ØOpen Analysis Setup and open the Sectioning panel. When the panel is first opened it will automatically search for the best option for one to five sections in the controlling pipe. The results will be displayed in the table at the top. Select the row to use one section in the controlling pipe.
Step 6. Define the Transient Control Group
ØOpen the Simulation Mode/Duration panel in the Transient Control group. Enter 10 seconds for the Stop Time.
All groups should now be complete and the model is ready to run. If all groups in Analysis Setup have a green checkmark then Click OK and proceed. Otherwise, enter the missing information.
Step 7. Run the Model
Click Run Model from the toolbar or from the Analysis menu. This will open the Solution Progress window. This window allows you to watch the progress of the Steady-State and Transient Solvers. When complete, click the Output button at the bottom of the Solution Progress window.
Step 8. Examine the Output
In the Output window, there is a warning that the Design Alert was violated for Pipe P4. The minimum value for the run was
There are several factors that may be contributing to this. Pipe P4 is sloped upward which increases the settling velocity and decreases the velocity ratio of concern. Also, the model has the pipes all 10-inch diameter. However, the main pipes P1 and P2 are carrying much more flow than the others so the pressure drop in these is greater. This can be reduced by increasing the size. The size cannot be increased too much because this would reduce the velocity ratio below the 1.2 minimum.
Step 9. Increase the Pipe Diameter and Rerun the Model
Return to the Workspace and change pipes P1 and P2 to 14-inch diameter. Since the size of the pipes were changed they need to be re-sectioned by opening the Pipe Sectioning and Output group in Analysis Setup. Click OK to accept the results.
Rerun the model and view the output. There should not be any warnings now that the pipes were changed. The Graph Results window will be more useful in understanding the results.
Step 10. Graph the Results
-
Go to the Graph Results window from the Window menu or by clicking on the Graph Results primary window tab.
-
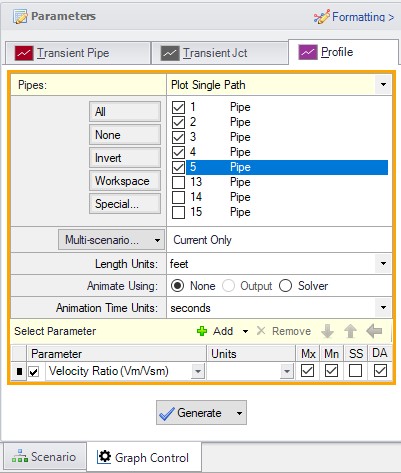
On the Profile tab in the Quick Access Panel, select pipes P1 through P5 (Figure 8). These represent the flow path to Deposit #1.
-
In the Parameter section, choose Velocity Ratio (Vm/Vsm).
-
Check the boxes for Mx, Mn, and DA in order to display the maximum, minimum, and Design Alert.
-
Click Generate.
The resulting graph is shown in Figure 9. This represents the flow path that had the velocity ratio Design Alert warning when 10-inch pipe was used. Now with 14-inch pipe the minimum is above the 1.2 limit along the entire path.
![]()
Figure 9: Velocity ratio in the flow path to Deposit #1 is above the minimum Design Alert of 1.2 at all locations
In the Graph Parameters section on the Quick Access Panel change the parameter to Pressure Static and the units to
You can also check the same parameters for the flow path leading to Deposit #2.
A time comparison of the velocity ratio in the critical pipes along the two flow paths is important to consider.
-
On the Transient Pipe tab, select pipes P4 Inlet and P7 Inlet and add them to the pipe stations to graph (Figure 11). These are the two sloped pipes which have the lowest velocity ratio.
-
In the Graph Parameters list choose Velocity Ratio (Vm/Vsm).
-
Check the DA box to display Design Alerts on the graph.
-
Click Generate.
The resulting graph is shown in Figure 12. This shows that as the valve J4 closes and valve J7 opens the velocity ratios in the pipe immediately downstream change but stay in the acceptable range.
SSL Analysis Summary
A slurry of sand and water flowing to two deposits was modeled. The velocity ratio was examined to insure a minimum valve was maintained throughout the transient to avoid the danger of the sand settling out of the slurry plugging the pipe. The analysis showed that the initial pipe diameter selected was not adequate. A larger size was selected to meet the system requirements over the simulation time.


