Graphing Output Values
|
When the input is for a range of values, the output can be plotted in a graph. To generate a graph of values, select the Graph button. This will open the Graph Properties window. The Graph Properties window controls the content and format of the graph to be plotted.
Select the properties to be plotted from the Graph Parameters window. Click the arrow on the right of the list boxes to see the entire list of available properties for each axis. The X-axis variable list contains all of the properties specified in the Output Control window. The units used for the properties displayed in the graph can be selected in the units list boxes next to the property names.
The title, labels, legends, axis scales, colors, symbols, etc., can be formatted for each graph. To format a graph, click the Format Graph button. See Setting Graph Options for additional information.
The graph can be printed, saved to a graphics file, or copied to the clipboard.
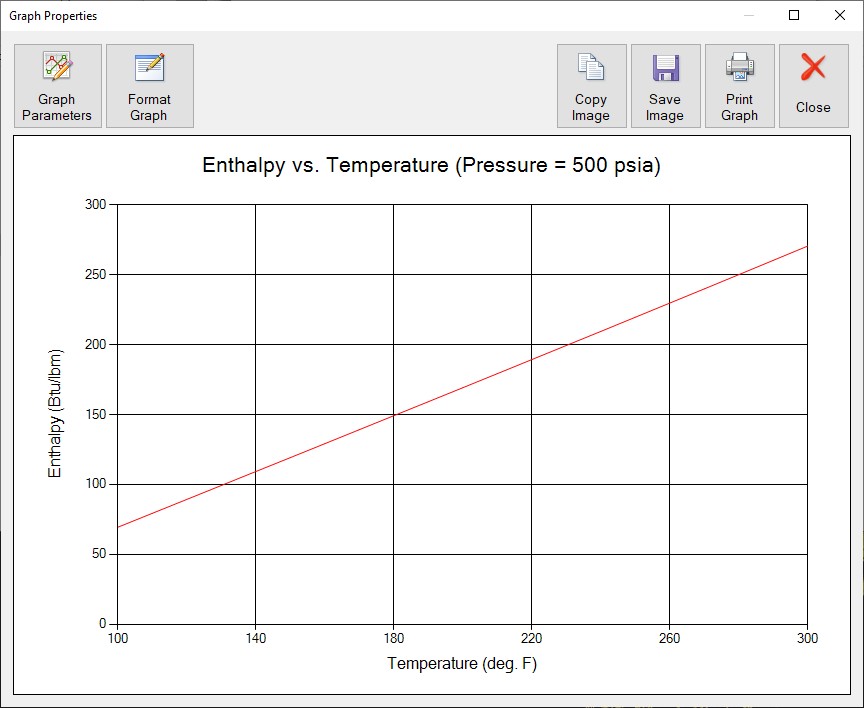
Figure 9: Properties for Range outputs may be plotted as a graph.