Parametric Study
Overview
The Parametric Study tool is designed to analyze a range of independent variables and to visualize the effect these changes have on listed dependent variables. The tool can vary multiple Independent variables through predetermined ranges, save the resulting dependent variables, and then display the results graphically in a separate standalone tool included in the program’s installation folder.
To use the tool, first create a fully defined model file that runs and presents output data. Navigate to Analysis Setup and find the Parametric Study item under the Solution Utilities group. Create a new study by pressing the Green Plus Sign and entering a name for the study. Multiple studies can be created and saved to a single model file. They can be selected from the available dropdown menu. Studies can be renamed, duplicated, or deleted using buttons next to the Study dropdown menu. To protect the program from running a particular combination of independent variables indefinitely, a default of 5 minutes is imposed on each individual run.
Defining Variables
Independent, Linked Groups, and Dependent Groups can be created for the selected study. Create a new Independent variable by selecting Add Independent. The Parameter Settings require a unique name, a type of input, such as Pipe Input or a specific Junction Input, the parameter that will be varied with a unit selection if applicable, and the junction that will be varied. Each Independent variable needs a distribution for what values the tool will use for a model run. Distribution options include:
-
Geometric
-
Linear
-
Specified Values
Suboptions for the different distributions could include a starting value, an ending value denoted as stop, a count of values that will be considered for the model runs, an increment between each independent variable, or a growth rate when using the geometric distribution. The specified values option allows for discrete values to be entered, separated by a semicolon. Do not add a semicolon after the final value.
Dependent variables are the values that will be stored in the parametric study output file. While the entire model needs to run for each combination of independent variables, only the dependent values will be saved instead of the entire traditional output file. The dependent variable will need a name, type, which correlates to the available output options, the parameter, and the pipe or junction that is being stored.
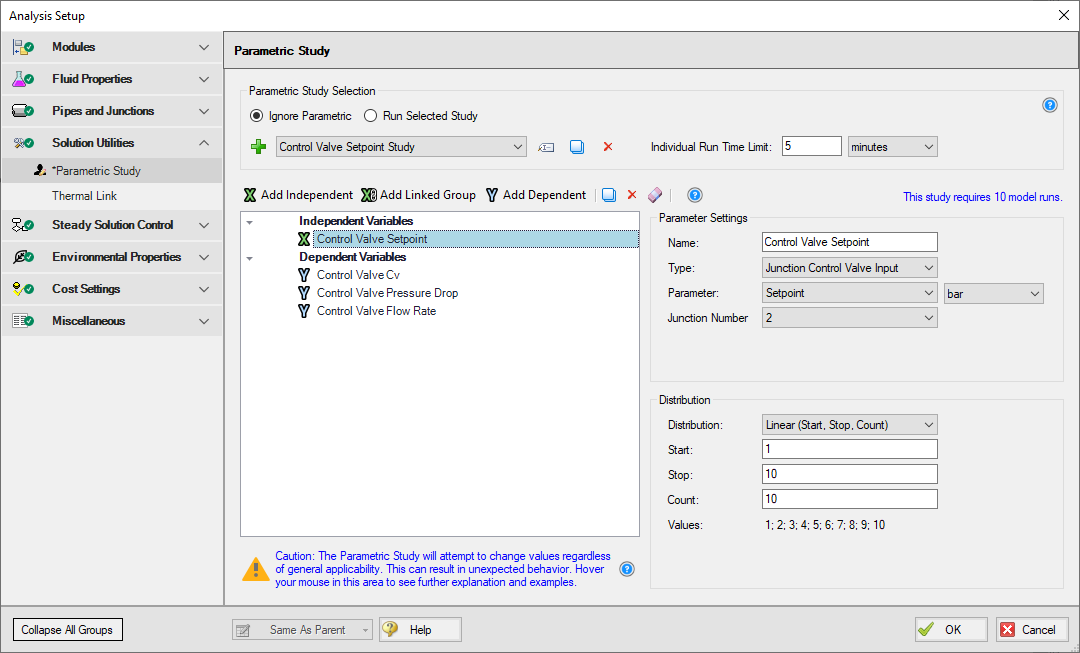
Figure 1: Parametric Study settings menu with defined Independent and Dependent Variables
Running the Study
Once a parametric study has been defined, it can be enabled in either of the following ways:
-
Select the Run Selected Study radio button within the Parametric Study menu.
-
Select the study from the Parametric Study dropdown menu in the main menu bar between Analysis Setup and Run Model options.
With a Parametric Study selected, the Run Model button will be replaced with the Run Parametric button. Beside the Parametric Study dropdown menu on the main menu are the Parametric Settings (gear icon) and Open Parametric Data Viewer (graph icon) options. Selecting Open Parametric Data Viewer will open the standalone application, but it will require a study’s output file to be used.
Selecting Run Parametric will open a separate window that will loop through all combinations of Independent Variables, denoting the Dependent Variables' calculated value, and listing any issues that occurred for the individual run.
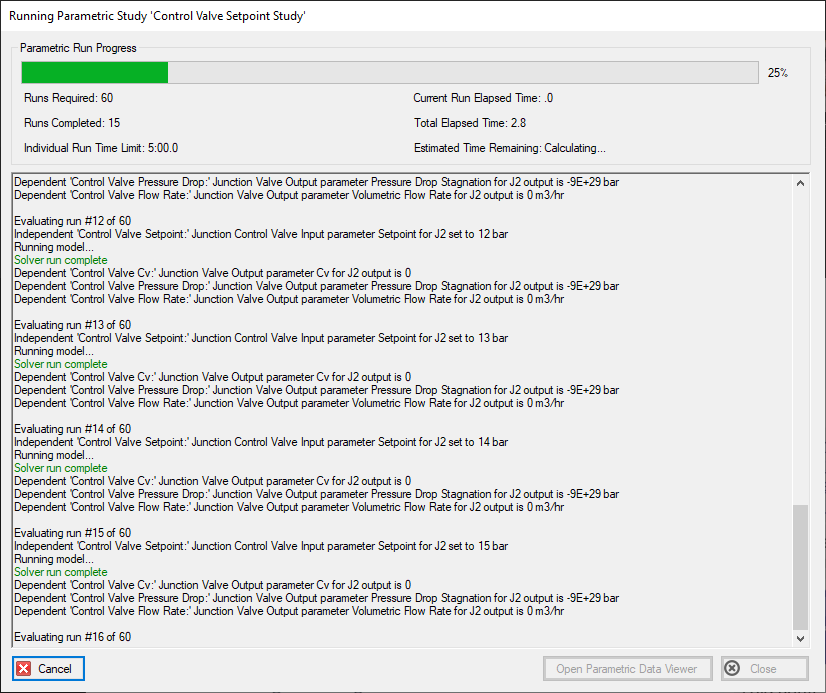
Figure 2: Parametric Study Runtime Window
Viewing Results
With an output file created, the Parametric Data Viewer can then be opened from the Parametric Study Runtime window, the main menu, or from the standalone application ParametricDataViewer.exe located in the program's installation folder.
The Parametric Data Viewer application has a range of options available, including graphing the available data and providing the raw results to be transferred to other tools for further analysis. Within the program is a ribbon of options to select a chart or series to edit, importing data from a clipboard, creating 2D and 3D charts, and viewing raw results. Selecting one of the 2D or 3D charts will open a menu to specify the X and Y Axes. Multiple Y Axes can be specified. The selection can either be used to create a new chart or be added to the currently selected chart. Multiple charts can be created and will be available as tabs below the ribbon and above the currently viewed graph.
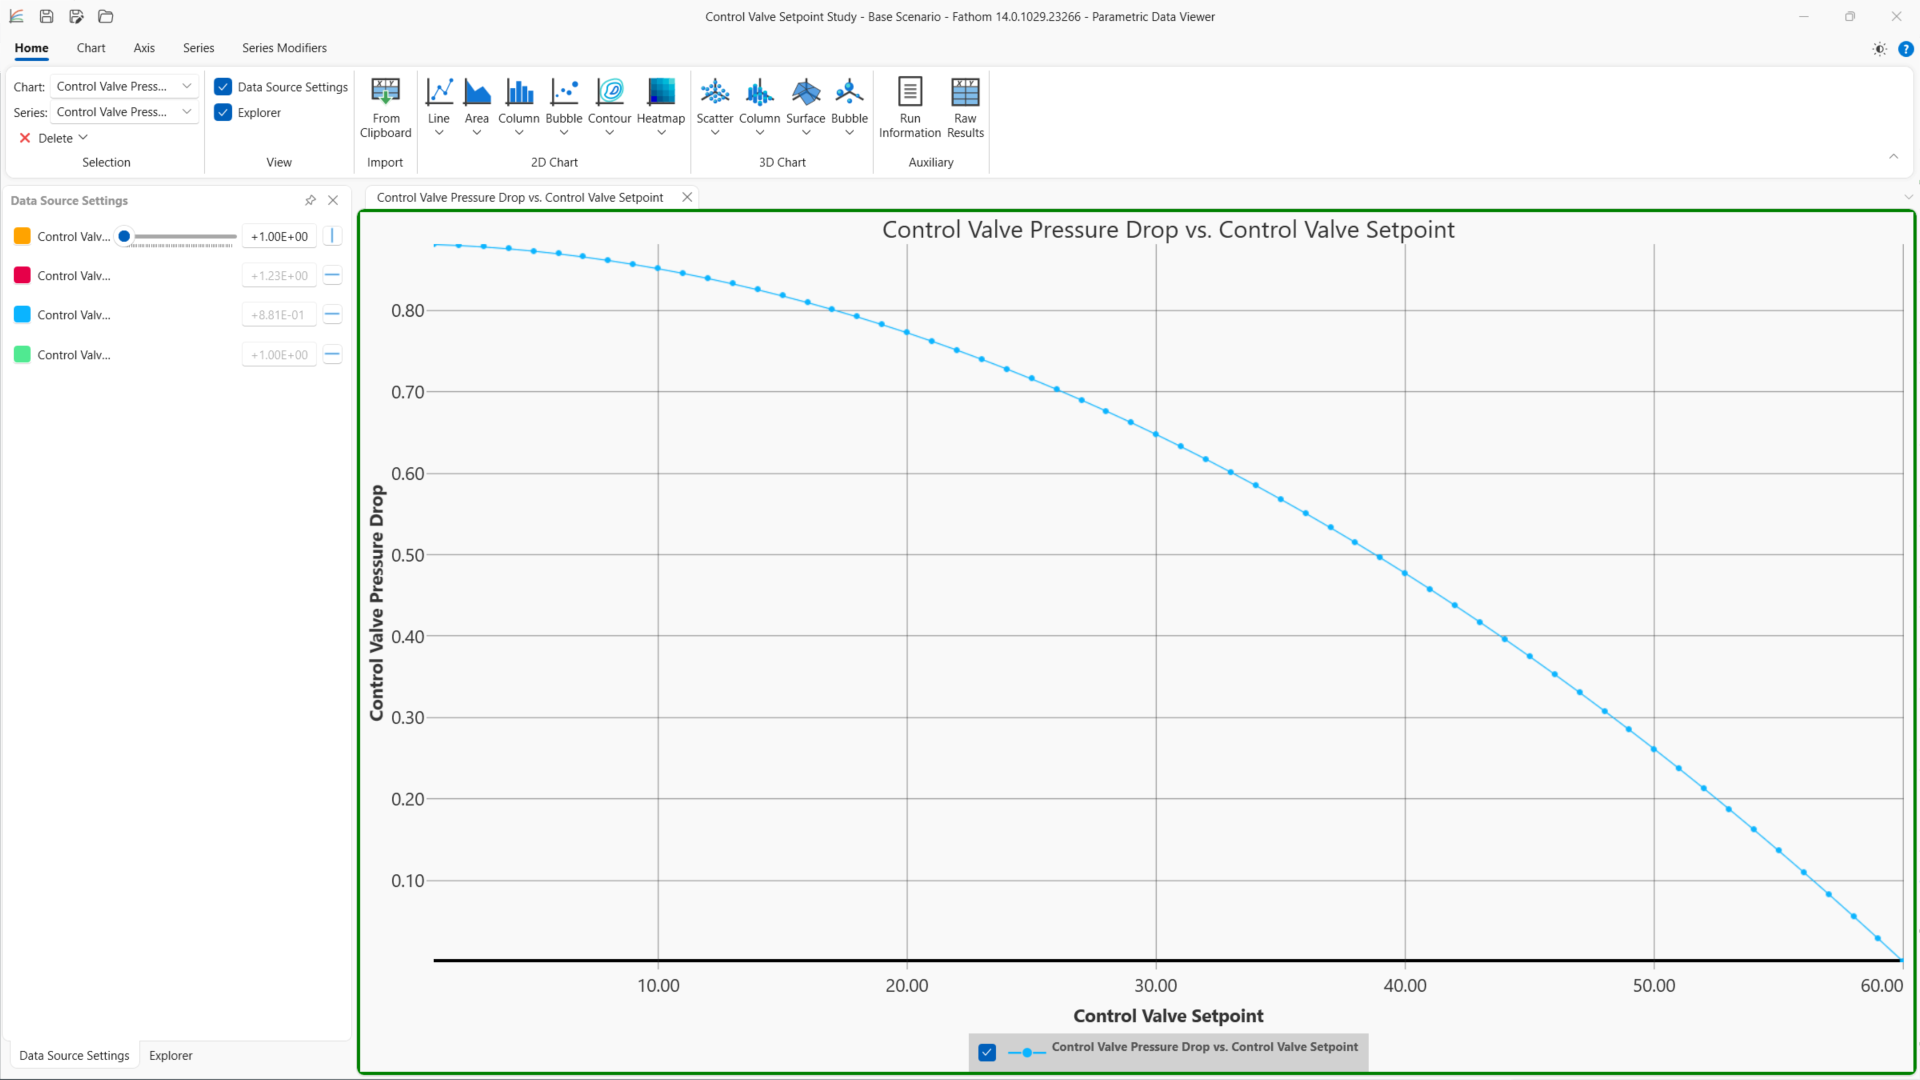
Figure 3: Example 2D Line Graph
Related Topics