Workspace Layers
Fundamentally, Workspace Layers are used to control the visibility of Workspace objects and labels. Layers allow custom views to be created in which results can be displayed without needing to leave the Workspace window. A group of layers functions like a stack of transparencies, with each layer displaying specific, customizable information. The view on the Workspace is a composite of the information presented by all visible layers, but all objects exist regardless of visibility for the purposes of calculations and object connections.

Figure 1: Information from all currently visible layers combines to form the view displayed on the Workspace
Layers can be shown or hidden to create different views of the Workspace. The visibility of objects on the Workspace depends on the layers that are shown, as objects on hidden layers are not shown on the Workspace unless present on another layer. If an object exists on multiple layers, only the top-most representation is visible. The order of the layers is controlled by the order in which they are listed in the Workspace Layers panel.
The Workspace Layers panel is accessed via the Workspace Layers tab in the Quick Access Panel. There are two areas within the Workspace Layers panel to control Layer Presets and Layers.
In the Layers area, new layers can be created, and any selected layers can be renamed, duplicated, and toggled in visibility. The Global Layers Settings menu is accessed here, and the column of visibility icons on the right shows the current visibility of each layer and can be clicked to toggle visibility. Hovering over a layer, a gear icon appears that links to the layer’s Layer Settings options for customization.

Figure 2: View of the Workspace Layers panel structure
Standard layers control pipe and junction styles, labels, and visibility, along with the visibility of any annotations in the model. Among the standard layers is the All Objects Layer. The All Objects Layer exists in all models and contains all pipes, junctions, and annotations in the model. This serves as the primary layer, provides a central location for users to quickly see all objects in the model, and is always the bottommost layer. When creating a view where some objects are hidden, the All Objects Layer can be toggled in visibility so that only objects visible in other layers are shown on the Workspace.
Other standard layers can be reordered up or down the layer stack using the areas at the top of the Layers area. For pipe and junction labels, the order of displayed text items is affected by the order of the layers containing label text.
Standard layers can be created from the New Layer drop-down as a Blank Layer or From Workspace Selections. Layers created from Workspace selections have the selected objects and their labels visible in the new layer.
By default, new objects are visible only on the All Objects Layer. However, if layers are set as Active Layers, then any new objects that are created and their labels will be visible within all Active Layers. Active Layers are set by hovering over a layer and clicking the pencil icon and any currently Active Layers are denoted by the pencil icon.
Layer Presets allow customized Workspace views to be retained by saving the status (visibility) of each layer. There are four columns in the Layer Preset area. One shows the name of the preset, the Load Preset option allows the previously saved layer states to be loaded onto the Workspace, the Update Preset option saves the current layer states to that Layer Preset, and the Link Preset option links that preset to the currently active scenario.
By linking a preset to a scenario, it will automatically load whenever that scenario is loaded in the future. Individual layers, by contrast, are not tied to a specific scenario and are defined globally and immediately available in all scenarios. A layer can only show objects that exist in the active scenario, and changes to the style of an object in a layer will affect all scenarios.

Figure 3: Global Layer Settings window
The Global Layer Settings are accessed from the double gear icon on the Layers Toolbar in the Quick Access Panel. The properties that are controlled by Global Layer Settings are not defined for individual layers – changes to these settings affect all layers globally.
Text and Graphics Options allow the analysis title, input filename, scenario name, and units in the legend to be toggled.
Note: The analysis title is set in the general tab of Output Control.
The Fonts setting controls the fonts for Data/Text (e.g. labels), the Title text (the analysis title, input filename, and scenario title if visible) and the text in the legend.
The Numerical Formats option determines the minimum number of digits shown for input and output data displayed within label text.
Layer Settings - Pipes & Junctions
The Layer Settings window can be accessed by double-clicking the layer, from the single gear icon on the right of each layer, or by selecting the layer and clicking the single gear icon on the Layers Toolbar.
The layout of the Layer Settings window is similar to Analysis Setup, with a number of groups listed on the left side of the window. Each group contains items that when selected change the content of the main panel area on the right.

Figure 4: The Show/Hide & Style panel allows the appearance and visibility of pipes and junctions to be managed
The Pipes & Junctions group of the Layer Settings window allows the pipe and junction color and size/thickness to be defined for a given layer, along with which pipes and junctions are visible. Note that changes to this panel are made live in real time, and no Apply button is needed to apply the changes that you make. Pipes and junctions are shown in two separate lists, which can be filtered.
Multiple pipes or junctions can be edited at a time using the Color, Size, and Thickness modifiers at the top of each table, or set to default options with the Defaults buttons towards the bottom. The usual tools for selecting pipes and junctions, including Workspace select and Select Special, are available here. Pipes and junctions may also be edited individually with the visibility, color, and size options in each row.
The appearance of new pipes and junctions is layer specific, and can be set to default options with the top Defaults button or modified with the New Pipe Color, New Pipe Thickness, and New Junction Size options. Note that color and icon style for new junctions are set via the Toolbox as they are specific to each type of junction.
List Pipes & Junctions from All Scenarios is toggled off by default to reduce unintended changes to items in other scenarios, but this can be toggled on to include objects from all scenarios in the lists.
Layer Settings - Label Control
A label is text that is associated with a pipe or junction on the Workspace. Labels include both input and output parameters along with object names, numbers, and workspace symbols. While there is no separate output mode, output parameters are only displayed when the current scenario has output data available. If no output is present, the parameter in the list to the right will appear grayed out. Input parameters will always be shown when added to the list on the right. The label shown for an object on the Workspace is a combination of defined label items from each visible layer, and the order of the items is determined by both the layer order and the order that parameters are listed within each layer.

Figure 5: The Junction Parameters panel within the Label Control group of Layer Settings
Within the Label Control group, the Pipe Parameters and Junction Parameters items allow for the parameters associated with a layer to be customized. When there is no output available, output parameters will be grayed out within the list, but their list position and units may still be edited.
Label locations are defined globally, so the Reset Label Locations option will apply to all labels in all layers and all scenarios.

Figure 6: The Show/Hide Labels panel determines which objects will have visible labels for a given layer
The Show/Hide Labels panel can be used to toggle the visibility of labels for each pipe and junction within a layer. This allows a user to create a layer that shows only the relevant parameters for the relevant objects in the model. Visibility can be modified for one or several objects at a time via the same methods as pipe and junction visibility.
The Force Shown Labels to Match Shown Objects option forces the visibility of each label to match its object visibility as defined in the Pipes & Junctions group of the Layer Settings. The Defaults options at the bottom of the tables simply toggle this option on if it had been previously unselected.

Figure 7: The Show/Hide Annotations panel shows all annotations that exist in the model file and allows their visibility to be controlled on a per-layer basis
The Show/Hide Annotations panel allows the visibility of annotations to be defined for the current layer and displays the visibility of each annotation in the current layer. While annotations exist globally, in concert with Layer Presets this menu allows annotations to be controlled so that they are only visible in the relevant scenarios. Annotations can be edited from this list view by double-clicking them in the list to open the annotation in the Annotation Editor.
A Color Map layer allows you to visualize magnitudes of various parameters by coloring the pipes. Color Maps are a special layer type, and are shown in a separate group on the Layers panel. There can be only one special layer visible at a time, and they override the behavior of standard layers in the model - in this case superseding any colors assigned to pipes by other layers.
Example use cases for Color Maps includes visualizing hot/cold loops, locations of high velocity/reverse flows, or pipe diameters/lengths.
To create a Color Map layer, click the new layer icon on the Layers Toolbar, select a Color Map layer type, and name the new layer. To edit the layer, go to its Layer Settings menu, accessed in the same manner as a standard layer.

Figure 8: Layer Settings window for a Color Map
In the Color Map Layer Settings window, choose a parameter and units for which all pipes will be categorized. Then choose the Number of Conditions (number of colors) and click Generate. The operators (i.e. >, >=, =, <=, <) and values can be modified. Values may be categorized on an absolute value basis by selecting the Use Absolute Value checkbox. The Show Value on Workspace Label option shows the evaluated parameter next to each visible pipe in the model, and combines with any other label text items from other layers.
The order of entry is not important. xStream will sort the entries first by value and then by the operator, with the greater than (>) operator being above the less than (<) operator. The pipes will be colored using the first match found in the map, starting from the top of the map. If no match is found, the pipe will be the Workspace pipe color. Be careful to avoid overlapping operators and values. If, for example, the map defined four colors using the following inequalities,
-
>=60
-
<60
-
>=20
-
<20
then there is no way colors 3 and 4 will be used because any pipe less than 20 is also less than 60. Since <60 is before <20 in the map, the pipe will be colored using color 2.
To avoid overlapping colors, only use less than (<) as the last entry. A better map would be the following:
-
>=60
-
>=20
-
<20
To delete a map value, select the row from the Color Map Grid and click the Remove Row button. Instead of coloring the pipes, it is possible to color just the pipe numbers. This is done by choosing the Color Pipe Labels radio button in the Color Options area. Alternatively, the Color Pipes and Labels radio button allows both to be colored.
Color choices from the Color Map Grid will appear in a legend without units shown by default. The legend may be repositioned by dragging it to any location on the Workspace. Units may be displayed in the legend using the Show Units in Legend setting within Global Layer Settings.
If there is no output for the current scenario, any Color Map layer that displays an output parameter will have a red exclamation mark next to it on the Layers panel to warn the user that there is no output. The model must run before such Color Map layers can be displayed.
Color Maps can be animated for transient data using Animation Layers. The interface for animating a color map layer is shown in Figure 9.
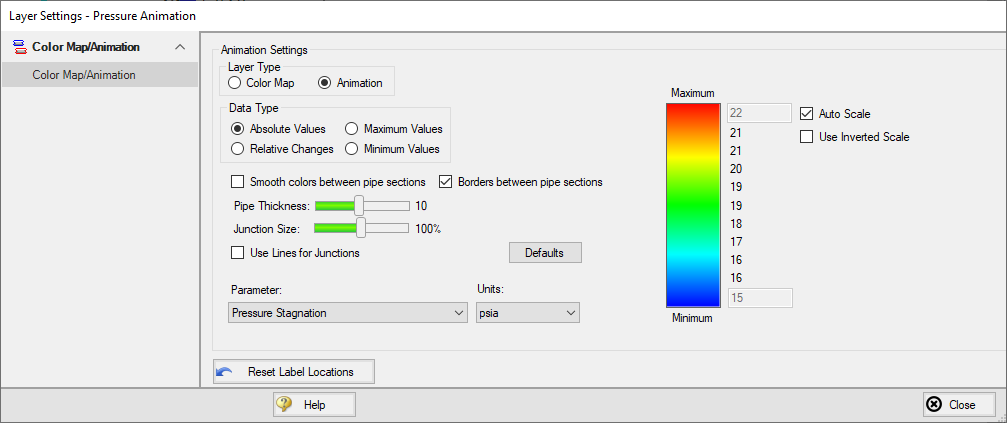
Figure 9: Layer Settings window for an animated color map layer
There are two buttons on the Layers Toolbar that can be used to save or load Layer Template Files which enable teams to create consistent layer formatting across different models.
Save Layers to File - Specific layers can be selected, including Color Maps/Animations, which will be exported to a Layer Template File (*.ltf). You can optionally choose for Global Layer Settings to be saved in the template file. The All Objects Layer cannot be selected or saved.
Load Layers from File - A Layer Template File (*.ltf) can be imported which will add layers on top of any existing layers in the model and overwrite the Global Layer Settings if they were selected to be saved in the template. If the template file contains parameters that are not available then they will be ignored and not loaded. It is also possible to load old Visual Report Control Files created from previous versions of the software. Model files themselves can also be selected as a supported file type which will copy all available layers from the model.
Workspace Layers Import Assistant
The Workspace Layers Import Assistant can be used when importing a model from xStream 2 or earlier. By default, when opening a model from these previous versions, layers are created as applicable for object numbers, workspace symbols, and object names. This is done regardless of whether or not the Workspace Layers Import Assistant is run.
The purpose of the Workspace Layers Import Assistant is to import visual styles of pipes and junctions and to import labels from the deprecated Visual Report Window as Workspace Layers so that previous Visual Reports can be recreated. This is a step by step guided procedure that will attempt to bring these elements into Workspace Layers while creating as few new layers as possible. These layers are created on a per-scenario basis.
If a model has a high number of scenarios with similar Visual Reports, it may be preferable to recreate the Visual Report manually as a new layer that can be used with any scenario. If the chosen scenarios for the Import Assistant share many of the same visual settings, the Import Assistant will create all relevant layers for each, even if those layers are identical to each other.
The Workspace Layers Import Assistant will allow you to select which scenarios to use to create the new layers. Once these are selected, the next page of the Import Assistant will allow you to see how many layers and Layer Presets will be generated. Once satisfied with the proposed Workspace Layers and Layer Presets, click Import Layers to complete the import process.
Related Topics


