Animation Layers
Animating the results of a transient run is an extremely powerful way to understand how a complex system is behaving. While transient plots of fluid parameters over time at a given location are valuable and easy to interpret, they do not directly convey the most important aspect of a fluid transient event - how the pressure and flow waves propagate through a system and interact with one another. Animating the results of a transient simulation allows you to observe these effects directly.
Unlike the Graph Results Animation feature, animated color maps provide the added benefit of being able to observe how waves propagate through branching paths and similar situations which are not restricted to one continuous flow path.
Saving Output for Animation
The Animation Layers feature works by referencing the output for each computational pipe section in the animated pipes. In order to accomplish this, data for each pipe station being animated must be saved to the Output File. xStream will save the data for all pipe stations by default. The pipe station output settings can be changed on the Pipe Sectioning and Output panel if needed.
Creating an Animation
To enable animation in the Workspace, a Color Map/Animations layer must first be created using Workspace Layers. The Layer Type will then need to be set to "Animation" in the Color Map/Animation panel in the Layer Settings window.
When Animation is selected in Layer Settings, the following Animation Settings become available.
-
Data Type
-
Absolute Values - This option directly uses the transient values for the pipes being animated. Impulse will then automatically generate evenly spaced values in between the absolute minimum and maximum which will be displayed on the color scale.
-
Relative Changes - This option displays the changes in the transient results relative to the steady state values in order to animate the delta throughout the run. Impulse will determine the maximum and minimum changes from the steady state, then automatically generate evenly spaced intervals between these values to display on the color scale.
-
Maximum Values - This option does not animate the data, but instead colors the pipes based on the maximum values during the transient for each of the pipe stations.
-
Minimum Values - This option does not animate the data, but instead colors the pipes based on the minimum values during the transient for each of the pipe stations.
-
Smooth colors between pipe sections - This choice sets the color gradient on the Workspace to be displayed as a smooth transition, rather than an abrupt transition in color.
-
Borders between pipe sections - This choice displays lines on the pipes to explicitly delineate the sections. This can only be enabled if the smooth colors option is disabled.
-
Pipe Thickness - This option adjusts the thickness of the colored animation pipes. The thickness of the original pipes can be adjusted in the Pipe Properties window on the Optional tab.
-
Junction Size - This option allows the size of the junctions on the Workspace window to be adjusted for the animated model. The junctions can also be set to 0% to automatically hide all junctions.
-
Use Lines for Junctions - This option allows the junctions to be represented as bold lines instead of symbols as an alternate method of displaying the junction locations.
-
Defaults - This button allows the user to reset the animation settings to the defaults.
-
Parameter - The parameter and units for the animation can be selected
-
Auto Scale - If this box is checked, Impulse will automatically choose the maximum and minimum values for the selected parameter to assign the color scale for animation. This box is checked by default.
Note: With Auto Scale active, minimums and maximums will be adjusted as appropriate for the active scenario and are not fixed to the maximum and minimum values that were applicable at the time of creating the layer.
-
Use Inverted Scale - This option flips the minimum and maximum values on the color scale so that lower values are warmer colors and higher values are cooler colors.
-
Maximum - The maximum value for the color scale can be changed here if the Auto Scale box is unchecked.
-
Minimum - The minimum value for the color scale can be changed here if the Auto Scale box is unchecked.
-
Reset Label Locations - This resets the location of pipe and junction labels to their default positions.
Animation settings are specific to each individual animation layer. While only one animation layer can be viewed at a time, many can be present in a model and can be toggled with visibility settings or via Layer Presets. Animation layers are not scenario-specific, but can be linked by Layer Presets to scenarios to automatically display when loading those scenarios in the same fashion as other layer types.
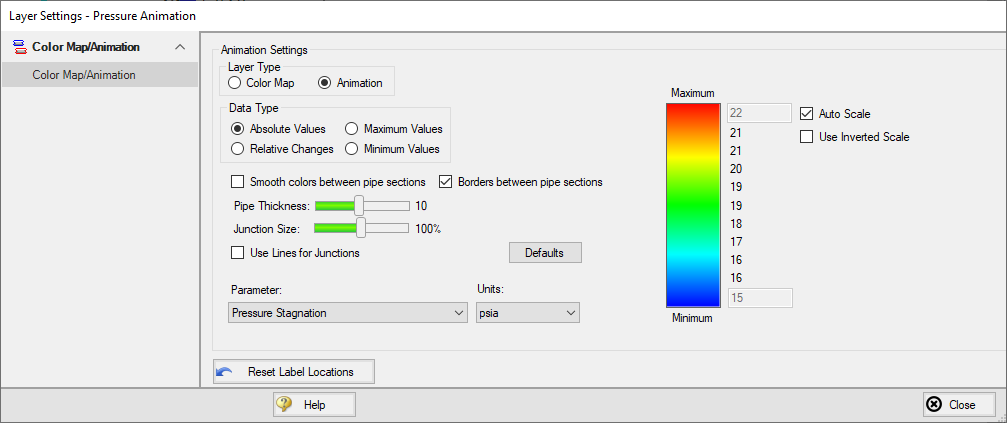
Figure 1: The Layer Settings menu for creating an animated color map
Viewing Animation
Once the Layer Settings have been configured and the animation layer is toggled to visible, several animation-specific components will appear, including the animation toolbar as shown below.
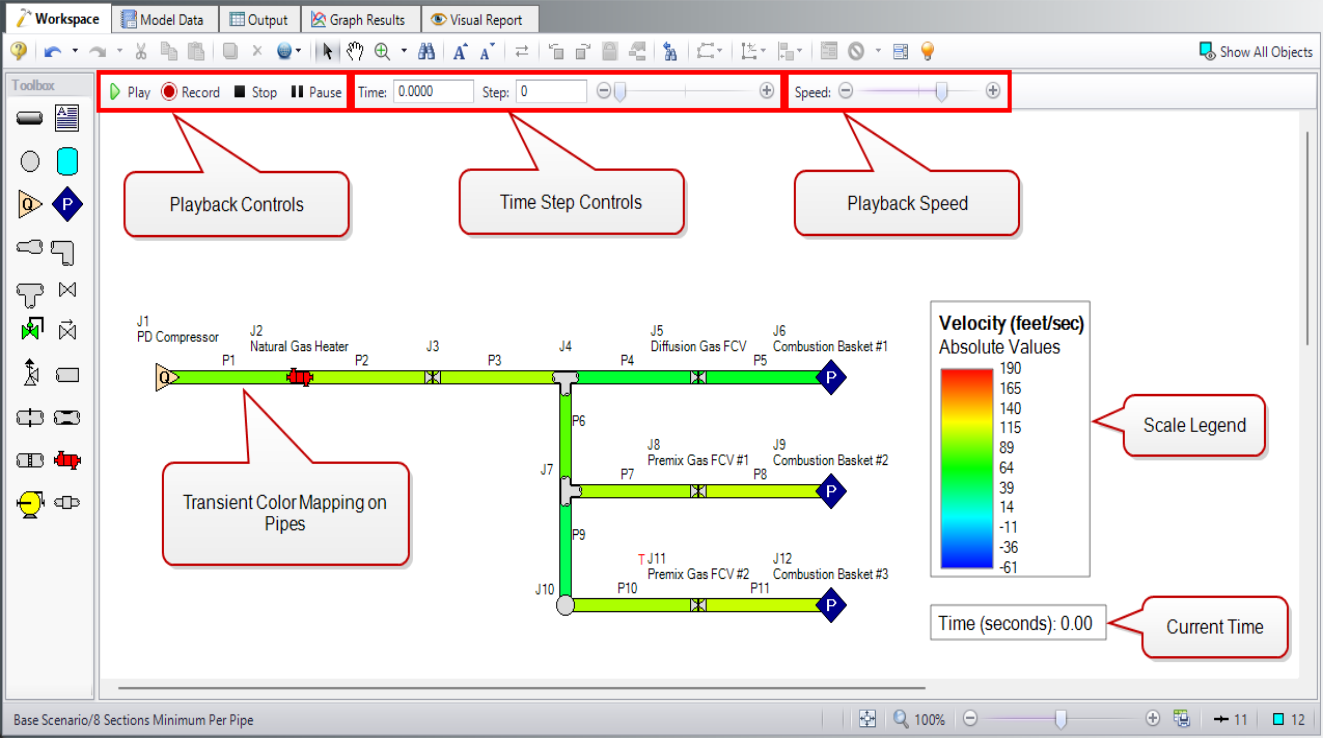
Figure 2: Components added to the Workspace window when an animation layer is visible
The animation toolbar has several controls:
-
Play - Start the animation from the current time.
-
Record - Begin playing the animation from the current step, and when the playback is stopped, prompt the user to save an .mp4 video recording of the animation to file.
-
Stop - Halt the animation and reset the time to zero.
-
Pause - Pause the animation at the current time.
-
Time - The actual simulation time of the currently displayed data.
-
Step - The simulation step of the currently displayed data.
Note: Input can be typed directly into the Time or Step text boxes to quickly navigate to a desired time step or to the one nearest to a desired point in time.
-
Time/Step slider - Seek for a certain point in the animation.
-
Speed slider - Change the speed of the playback.
The Current Time box and Scale can be moved anywhere within the Graph area.
Using Animations to Interpret Behavior
There are many ways that animations are helpful in interpreting behavior. Below, we consider the simple case of a valve closure. Visualizing pressure changes or velocities over time allows an engineer to see how pressure waves propagate through a system, including where they originate, their timing and magnitude, and how they reflect within the system. Animation Layers communicate this information more clearly than graphs and numbers alone, providing additional insights.
Figure 3: Transient velocities in the pipes can be directly visualized


