Graph Results Window
The Graph Results window, shown in Figure 1, allows you to generate high quality printed graphs.
The Graphing panel offers several types of standard graphs for compressor/fan vs. system, profile, and transient (XTS Module Only) information. Users can also control graph content to plot information for multiple parameters, pipes, paths, or scenarios simultaneously.
Results can be graphed as linear or log versus linear.
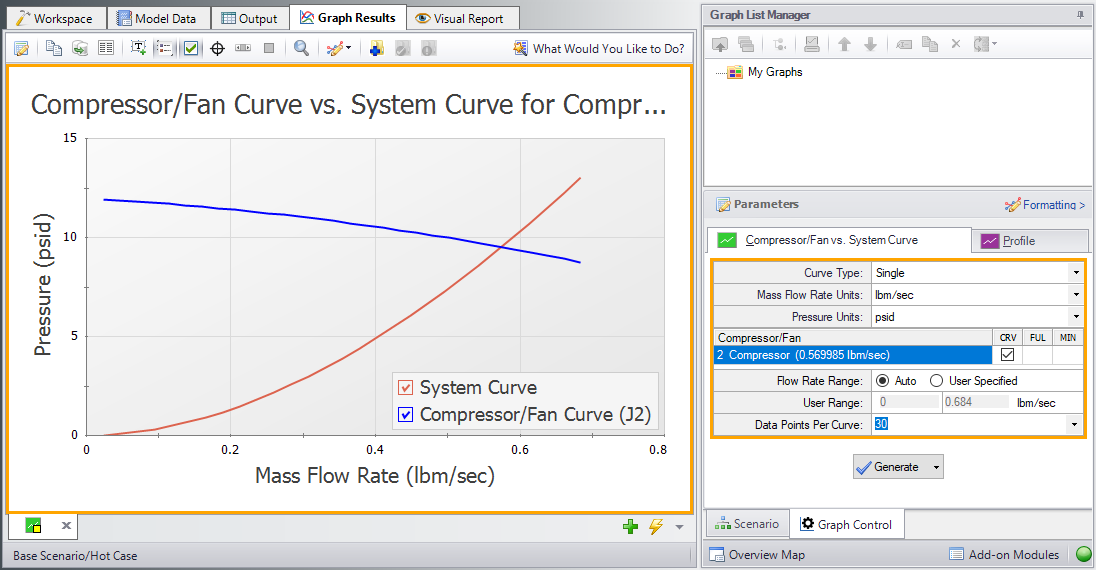
Figure 1: The Graph Results window offers full-featured plot generation
The Graphing panel lets you control the content of the graph and offers several types of standard graphs.
Graph List Manager
Allows the user to create, update, and even replace unique graphs that can be regenerated with new data. Multiple graphs can be displayed at the same time and organized into separate Folders. The default folder is named “My Graphs” and more folders can be created using the “New Folder…” icon on the Graph List Manager Toolbar or by right clicking on “My Graphs” and selecting “New Folder…”
Once a folder is created and selected, a Graph can be added to its list by selecting the “Add Graph to List” icon found on the Graph Results Toolbar. This can also be done by right-clicking anywhere on the graph. Once Graphs are in a Folder individual Graphs can be generated in unique tabs or each Graph in a Folder can be displayed in a single tab by right clicking on the Folder and selecting “Load Current Folder Graphs in New Tabs” or “Load Current Folder Graphs in Same Tabs”. These options are available in the Graph List Manager toolbar as well. Other options that can be found by right clicking on a Folder or Graph in the Graph List Manager or on the toolbar are:
-
Load Graph Item in Current Tab – Regenerates the graph in the currently active tab.
-
Load Graph Item in New Tab – Creates a new tab and regenerates the graph there.
-
Load Folder items - Regenerates all the Graphs in a Folder in separate tabs, in the same tab side by side, or in the same tab as stacked graphs, depending on the selection.
-
Keep Folder Display Layout - Saves the current layout when multiple graphs are loaded on the same tab.
-
Reset Folder Display Layout - Resets the Graph List Folder to the default layout when multiple graphs are loaded on the same tab.
-
Close Open Folder Items - Closes any graphs that were opened from the current folder.
-
Delete Folder Items - Deletes all graphs in the current folder.
-
Print Preview All Graphs in Folder - Displays a print preview of all items in the current folder.
-
Move Graph Item Up – Moves the selected Item up one level.
-
Move Graph Item Down - Moves the selected Item down one level.
-
Rename Graph Item - Changes the name of the Item.
-
Duplicate Graph Item – Creates a copy of the selected Item with a new name.
-
New Folder – Creates a new Folder where more Graphs can be saved to.
-
Delete Graph Item – Removes Item from the Graph List Manager.
-
Move Graph Item To Folder – Moves the selected Item to a previously existing Folder or a new Folder.
Graph Results Toolbar
The Graph Results Toolbar also has many options that are available right clicking on the Graph Results space at any point. These options are:
-
Select Graph Parameters – Select the type of Graph to create and its parameters.
-
Add Graph To List – Saves the Graph to the currently active list allowing it to be regenerated in the future.
-
Update Current Graph In List – Saves any changes to the current graph that have been made. (e.g. Changing the Graph Title or Line Style). Note that it is preferred to use the Replace Graph in List option if changes to the parameters or objects/paths being shown have been made.
-
Replace Graph In List – Replaces the outlined and current Graph with the Graph in the Graph List that has a gray background
-
Copy Graph Image – Copies a .jpeg of the Graph to the clipboard
-
Copy X-Y Data – Copies the X-Y used by the Graph to the clipboard
-
Show Data – Displays the X-Y data used to generate the graph in a column to the right of the graph
-
Right-clicking on the x-y data set provides further options to find the maximum or minimum in the data set, create an annotation on the graph for a data point, or to copy an individual data point
-
-
Create Annotation – Add an annotation to the graph that can be formatted and saved to be reloaded with the Graph in the future.
-
Show Legend – Toggles the legend off and on.
-
Show Check Boxes in Legend – Adds a check box in the legend that allows the user to selectively turn off and on certain curves in a Graph without having to recreate a new Graph.
-
Show Cross Hair – Displays and cross hair that shows the cursors X-Y values along the X and Y axis. This also displays the nearest data point X-Y values in a tooltip. If this feature is used at the same time as "Show Data" the Cross Hair will focus on that highlighted data point and display its values in a tooltip. The user can also change what data point is highlighted with the arrow keys and the Cross Hair and tooltip will move to that datapoint.
-
Show Range Finder – Adds a toolbar at the bottom of the graph that displays the entire X axis, but allows the user to zoom in to a specific range by clicking and dragging the handles on either side of the range finder.
-
Show Junction Locations – Add a vertical line with the number of the junction labeled at the location of the junction along the flow length.
-
Zoom to 100% - Resets the focus of the graph to 100%
-
Format – Allows the user to change the Graph’s format. Including
-
Header, Axis, and Legend names and fonts.
-
X and Y scaling
-
Line color and thickness
-
Graph Outline Colors
The active graph will always have an outline which indicates what state it is in.
-
Orange – Graph not added to list
-
Dark Green – Graph added to list
-
Light Green – Graph added to list, but changes have occurred. These can be saved and make they graph dark green by selecting “Update Current Graph in List” on the toolbar.
Graph Tab Icons
Each Graph Type has a specific color associated with it. This color will display in the box on the tab for the Graph. The colors are below:
-
Green – Compressor/Fan vs. System
-
Profile – Purple
-
Blank Graph – Gray
These tabs also display if the Graph in the tab is not saved or has been changed from the original Graph List item by showing a small yellow square over the tab's icon. If the current graph has been saved, there will be no yellow square.
Graph Tab Actions
-
New Tab – Creates a blank tab in which a new type of Graph can be generate and added to the Graph List Manager
-
Tab Actions
-
Close Active Tab
-
Close All Tabs
-
Close All But The Active Tab
-
Two Vertical Tab Groups
-
Two Horizontal Tab Groups
-
Reset to Single Tab Group
-
Tabs on…. – Selects the location of tabs (defaults to the bottom of the Graph)
-
-
Graph Tab Selection – Selects a Graph for the Graphs currently in the tabs based on name.
Cross-Plotting Features
The graphical data can be exported to a file for later import as a cross plot against results for a different model. For example, let's say you would like to see the effect on the system pipe pressure drop when you change a valve loss factor. You could run the Solver for one value of K and export the results to a file. Then you could rerun the Solver for a new value of K and import the results from the previous case for cross plotting. These features are accessed using the Save Graph Data and Import Graph Data items on the Graph Results File menu.
The Graph Results window is always erased when you make changes to model input. Rerun the model to graph the new results.
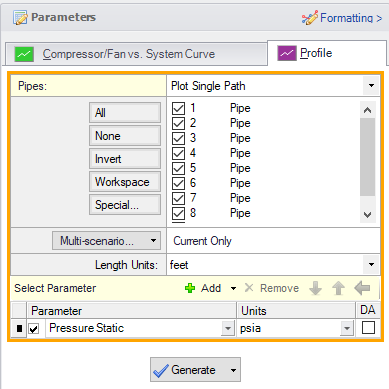
Figure 2: The Select Graph Parameters window controls the Graph Results window
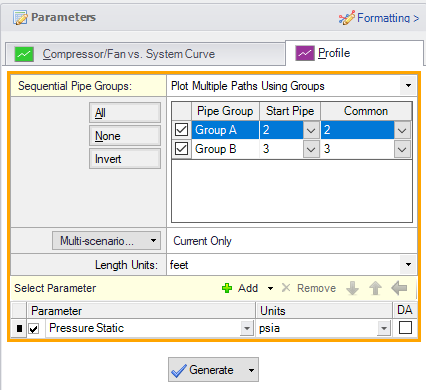
Figure 3: Multiple paths can be cross-plotted using predefined groups
Printing and Exporting
The Graph Results image can be:
-
Copied to the clipboard
-
Saved to a picture file
-
Saved directly to an Adobe PDF file
-
Sent to the printer
The x-y data in the Graph Results graph can be:
-
Copied to the clipboard
-
Exported directly to Excel using the Excel Export Manager
-
Exported to a delimited file suitable for direct importing into spreadsheet software
Related Topics
Compressor Fan vs. System Curve Methods
Multi Scenario Compressor Fan Vs. System Curves Tutorial
Related Examples
Related Blogs