Multi-Scenario Pump vs. System Curves Tutorial
When a model file has multiple scenarios that have pumps in them, a graph containing multiple pump curves and/or system curves can be generated for the purpose of comparison. To create a multi-scenario pump vs. system curve graph, two options are available:
-
Standard Method: Save pump vs system curve graphs for each individual scenario to be included in the graph. This allows the user to define settings such as the flow range for the pump vs system curve on an individual scenario basis, but is more time consuming.
-
Batch Run Method: Create a template pump vs system curve graph, then set up a batch run to automatically generate the pump vs system curves for all scenarios to be included in the graph. This allows for a faster process.
Standard Method
-
In the Graph List Manager select "New Folder". Provide a name for the folder, and check the box to "Make Multi-Scenario Pump Vs. System Folder", as is shown in Figure 1. This folder will be used to save the curves from the individual scenarios that will be included in the multi-scenario graph.
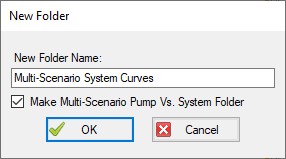
Figure 1: Creating a Multi-Scenario Pump Vs. System Folder
-
Load the first scenario you want to add to the graph, and run the scenario so that Output is present. Generate a Pump vs. System Curve for the scenario.
-
Add the Pump vs. System Curve to the Multi-Scenario Pump Vs. System Folder. This can be done by selecting the Multi-Scenario folder in the Graph List Manager, then clicking the Add Graph to List button, and naming the graph. The graph should now be shown subordinate to the folder, with the scenario name listed next to it in red, as is shown below.
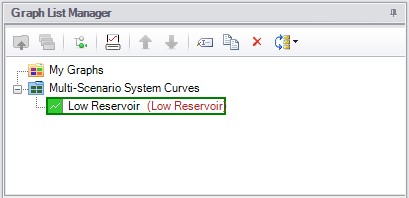
Figure 2: The name of the scenario that each Pump vs. System Curve was created in is displayed in the Graph List Manager
-
Repeat steps 2 and 3 for all scenarios that will be included in the graph.
-
When all of the individual Pump vs. System curves have been added to the folder, right-click on the folder name and choose "Load Multi-Scenario Graph," as is shown in Figure 3.
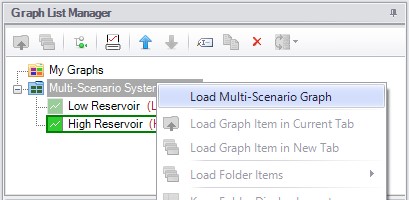
Figure 3: A Multi-Scenario Graph can be loaded from a Multi-Scenario graph folder
-
In the Multiple Scenario Graph Selection window select which curves you would like to include in the graph, then choose Generate Graph as is shown in Figure 4.
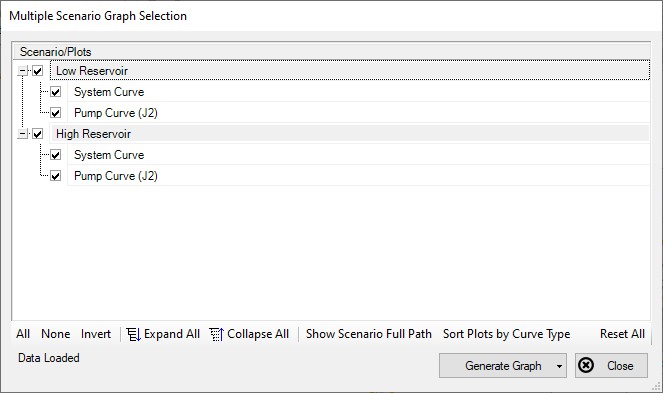
Figure 4: Multiple Scenario Graph Selection
-
The selected curves will now be displayed on a single graph, as is shown in Figure 5.
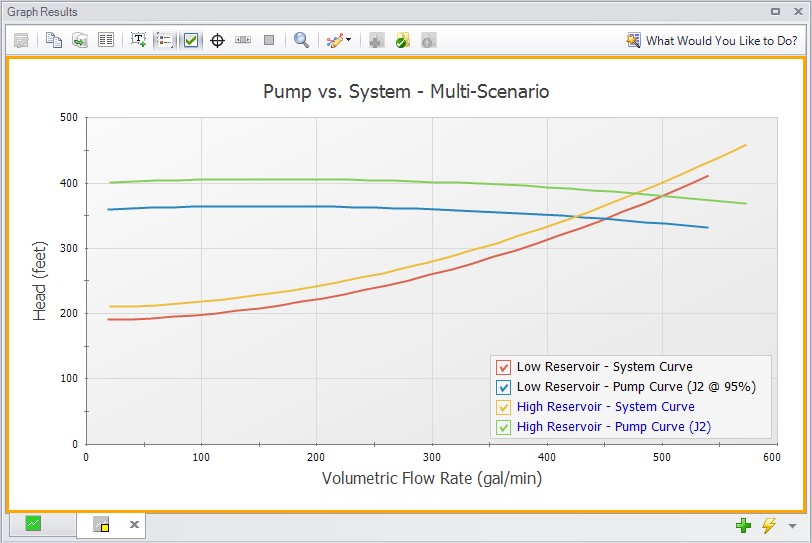
Figure 5: Multi-Scenario Pump vs. System curve
Batch Run Method
To speed up the process outlined above when making Multi-Scenario Pump vs. System curves for more than a handful of scenarios, the Batch Run tool can be used. Follow the steps below to create the curves.
-
In one of the scenarios being included in the Multi-Scenario Pump vs. System curve, generate a single scenario Pump vs. System curve and save it as a standard Graph List item. This curve will be used as a template for all the other scenarios, and should be for a pump common to all scenarios.
-
Launch the Batch Run window found in the File menu. Select the option to have the Batch Runs create Multi-Scenario Pump vs. System curves, and select the template Pump vs. System curve as shown in Figure 6. If you have multiple templates, all options will be shown for selection.
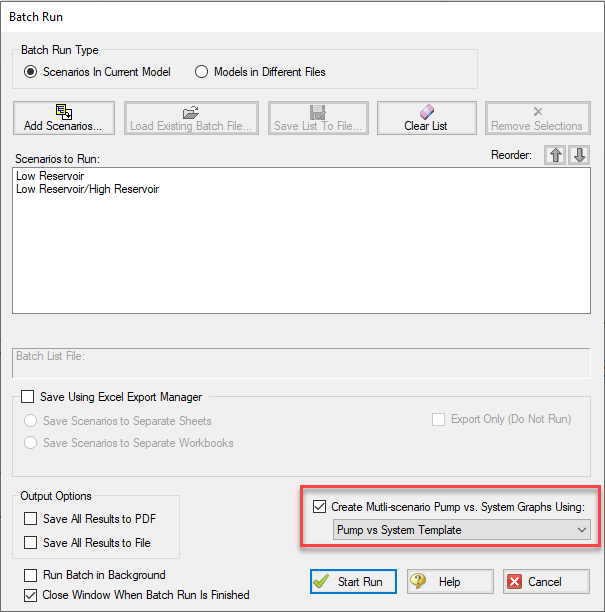
Figure 6: Multi-scenario batch run option enabled in the Batch Run window
-
Add the desired scenarios to run to the list and start the run.
-
Once the run is complete, navigate to the Graph Results tab. In the Graph List Manager, there will be a Multi-Scenario Pump System Curve folder named with the date and time of the run. Right-click on the folder name and choose "Load Multi-Scenario Graph," as is shown in Figure 7.
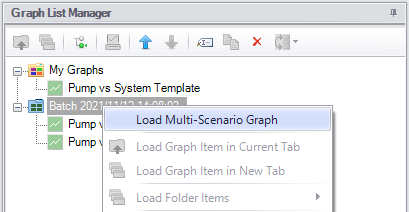
Figure 7: A Multi-Scenario Graph can be loaded from a Multi-Scenario graph folder
-
In the Multiple Scenario Graph Selection window select which curves you would like to include in the graph, then choose Generate Graph as is shown in Figure 8.
Figure 8: Multiple Scenario Graph Selection
-
The selected curves will now be displayed on a single graph, as is shown in Figure 9.
Figure 9: Multi-Scenario Pump vs. System curve
Related Topics
Related Blogs
Know Your Pump & System Curves - Part 1
Know Your Pump & System Curves - Part 2A
Know Your Pump & System Curves - Part 2B
Know Your Pump & System Curves - Part 3
Getting there is graph the fun! - Multi-Scenario Pump vs. System Curves


