Graph Types
AFT Fathom offers several types of graphs to help users better understand and interpret their data. Each type of graph is given a brief description below.
Pump vs. System Curve
This graphing option allows you to plot a pump curve versus a system curve for a single pump or group of pumps.
Note: The Pump Curve vs. System Curve is only available if there is a pump in the model
You can create pump vs. system curves for complex parallel flow networks. Composite pump curves for pumps in parallel or in series can also be also generated. If you create a composite pump curve, you can also show single pump curves on the same graph. If efficiency data exists you can cross-plot the efficiency curve.
If POR or AOR have been defined in Pump Configuration, these items can be displayed on the Pump vs. System graph.
If control valves are present in the model the control valves will be excluded from the Pump vs. System curve by default. Excluding the control valves will set them to be fully open for all flow rates. This option is useful to prevent convergence issues.
Pump vs. System curves can be displayed in two ways when parallel pumps are selected. One way is the “traditional” method which is how AFT Fathom displayed them in AFT Fathom 6.0 and before. The second method is called the “enhanced” method and it attempts to determine the flow split on the pumps and adjust the system curve accordingly. It also attempts to create a better composite curve when parallel pumps are dissimilar. For more information see Pump vs. System Curve Methods.
Pump vs. System curves for different scenarios can be plotted together on one graph by adding individual pump vs. system curves to a Multi-Scenario Pump Vs. System Folder, then loading them together in a single Multi-Scenario graph. For detailed information on how to do this see Multi-Scenario Pump vs. System Curves Tutorial.
Profile
This graph category will allow you to plot the selected parameter(s) along a flow path. In order to generate this graph, the specified pipes in the Select Graph Parameters window that comprise the path must form a single, continuous path. If they do not, an error message will appear and inform you which pipes are preventing the path from being continuous. The independent variable in these graphs is the length along the pipe(s).
A path of pipes can be specified in several ways. First, the user can select the pipes in the displayed list. Additionally, you can select the path on the workspace, and then use the Workspace button on the Select Graph Parameters window to automatically select all pipes currently selected on the Workspace. These methods permit that only a single path to be specified.
A profile graph can also be generated directly by selecting a single, continuous flow path in the Workspace, then right-clicking the Workspace and choosing the desired parameter under "Generate Profile Graph."
One or more flow paths can be specified using groups. To do this change the profile plot from "Plot Single Path" to "Plot Multiple Paths Using Groups" at the top of the parameter selection area. Only those groups that consist of a continuous pipe sequence will be displayed as an option in the Select Graph Parameters window.
Multi-Scenario Graphing Features
Starting with Fathom 12, users can plot information from multiple scenarios in the same graph for profile plots (or Transient plots with the XTS Module). Note Multi-Scenario Pump vs System curves are generated using a different method.
In the Select Graph Parameters window, the button for 'Multiple Scenarios' allows users to select the scenarios in the model they wish to plot for a particular graph. The same pipe layout must exist for all scenarios being plotted in a graph. Design alerts cannot be included in multi-scenario plots.
The active scenario must be included in a multi-scenario graph. When creating a new graph, users are not able to deselect the current scenario. When a user loads a saved Graph List Item that does not include the active scenario, Fathom will add the active scenario into the Graph List Item, but will not save the active scenario into it.
Scenarios can be selected using the Multi-scenario... button as shown in Figure 1 below.
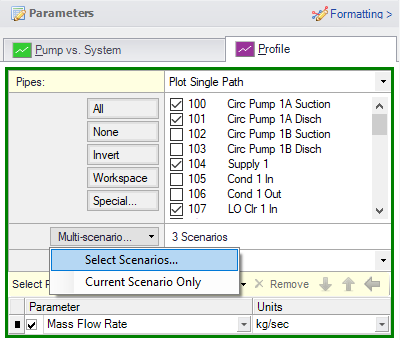
Figure 1: Graph Parameters window showing Multi-scenario selection options
Transient
(XTS Module Only) The Transient allows you to create plots of pipe and junction output with time as the independent parameter. See Transient Graph Results.
The overall maximum and/or minimum values can be plotted. Both of these graph types support animation.
To graph the results at a particular point in time, select the animation option and use the tools provided to display the desired time.
Slurry System Curve
(SSL Module Only) Special system curves can be generated for slurry modeling. See Graphing Slurry Results.
Related Blogs
Know Your Pump & System Curves - Part 1
Know Your Pump & System Curves - Part 2A


