Poor Pump Curve Fits
The Pump Properties window allows curve fits of pump data up to fourth order. Depending on the number of data points entered, pump curves fits that look like the orange curve in Figure 1 are possible.
AFT Fathom interprets flow rates past the inflection point around 80 as acceptable operating points, which can lead to unusual results or non-convergence. Users should always ensure that their pump curves cross the flow rate axis as shown in the blue curve in Figure 1.
AFT Fathom will attempt to warn the user when a model containing a pump curve fit as seen in Figure 1 is run. The user can choose to run the model with this curve fit anyways, but they should take care that the pump is not operating to the right of the inflection point.
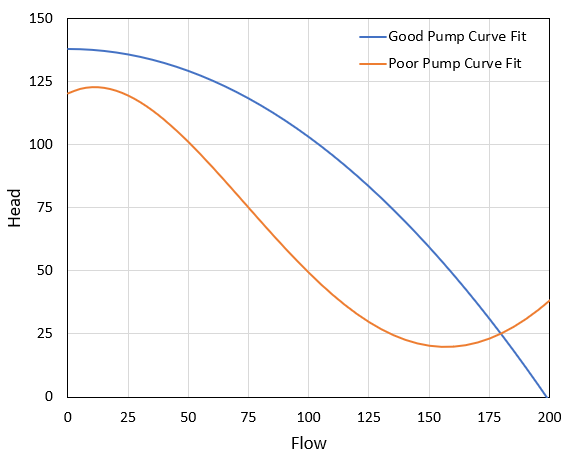
Figure 1: A good pump performance curve fit in blue and a poor pump performance curve fit in orange. All pump curve fits should include sufficient data such that the curve crosses the zero pressure rise axis as shown in the blue curve.


