Pump Configuration
The pump configuration window is used to define the specific operation of a centrifugal pump. It is opened with the Enter Curve Data button from the Pump Properties Pump Model tab when Centrifugal is selected.
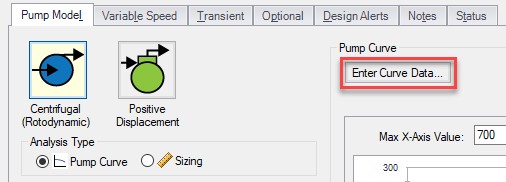
Figure 1: Enter Curve Data
Configuration Method
By default a pump is defined as a Simple configuration. This indicates that the pump junction can represent only one pump - defined by the curves in pump configuration.
If the Configuration Method is changed to Multiple, additional input becomes available on the right of the configuration window. This allows defining different operating speeds or impeller diameters for this pump, along with those configuration's specific curves. See a detailed description in Multiple Configurations.
The first tab of the pump configuration controls the pump's most basic behavior - the pump curves.
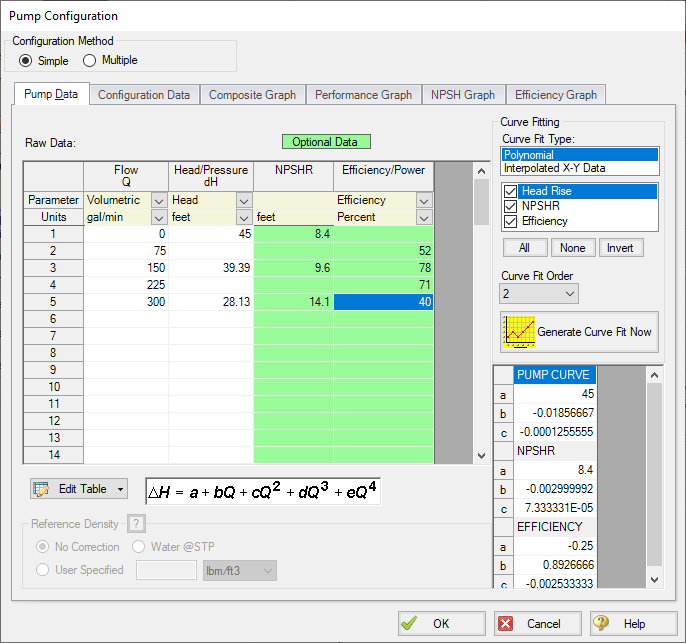
Figure 2: Pump Data
A Pump can have three curves defined:
-
Flow vs. Head/Pressure - Required. This is what is commonly referred to as the "pump curve" and defines how much head a pump can add to a fluid at any given flow rate.
-
Flow vs. NPSHR - Optional. The NPSHR varies with flow and can be specified for a pump. Without specifying this curve, it is impossible to determine if cavitation may exist within the pump.
Note: NPSHR calculations require a reference elevation, which is defined in the Pump Properties window. For most pumps, the NPSH Reference elevation is the centerline of the suction of the pump. However, this should be checked with the pump manufacturer to determine where the NPSH curve is referenced.
-
Flow vs. Efficiency/Power - Optional. The efficiency or power curve can be used to calculate the Best Efficiency Point (BEP), which is used for a variety of purposes. The definition of this curve also allows for the calculation of the actual power used or efficiency of the pump at its operating point. Without this curve, pump efficiency is assumed to be 100%.
After entering the raw values into the table, the data needs to be curve fit.
If Mass Flow, Pressure, or Power are used in the curve definitions, Reference Density becomes an additional required input.
This tab controls some additional behavior or input for a pump junction. Entering or changing values on this tab is optional.
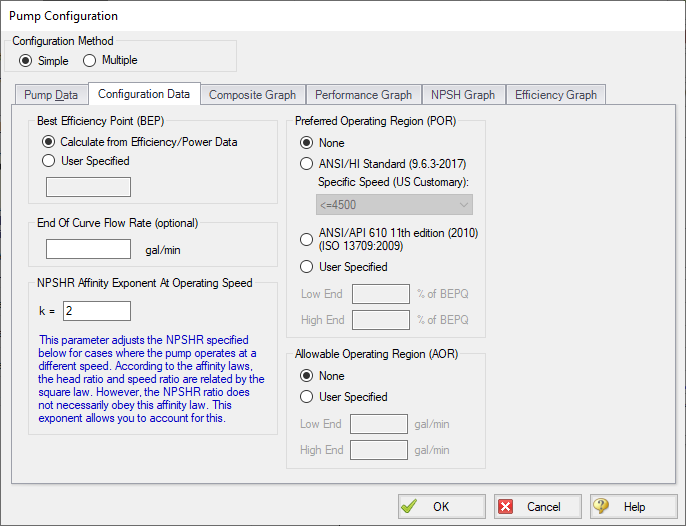
Figure 3: Configuration Data
-
Best Efficiency Point (BEP) - The Best Efficiency Point (BEP) by default is calculated from the entered efficiency or power curve. This is generally the preferred option as it best relates to the true meaning of BEP. A User Specified value can be entered if no efficiency or power curve is available, or if it is desired to force the BEP to a certain flow.
-
End Of Curve Flow Rate (optional) - This value is used to create a warning in the output if it is exceeded. It does not affect the solution - the model will behave identically however this value is defined.
-
NPSHR Affinity Exponent At Operating Speed - Pump curves - flow, head, and power - generally follow the affinity laws. However, NPSHR does not always follow a standard relationship. The default is to assume the NPSHR varies with the square of the operating speed. If this is not the case, the value can be adjusted here.


-
Preferred Operating Region (POR) - The region where the pump operates most effectively. Percent of BEP values falling outside of the defined range will generate a warning in the model output. This range can be taken from HI 9.6.3-2017ANSI/HI Standard 9.6.3-2017, Rotodynamic Pumps - Guidelines for Operating Regions, 2017, published by Hydraulic Institute, 6 Campus Drive, Parsippany, New Jersey, USA based on the specific speed of the pump, from ANSI/API 610 (2010)ANSI/API 610 11th Edition - Centrifugal Pumps for Petroleum, Petrochemical and Natural Gas Industries, 2010, published by American Petroleum Institute, 1220 L Street, NW, Washington DC, USA, or can be defined by the user.
-
Allowable Operating Region (AOR) - When an AOR is defined a warning will be created in the output when the user specified flow range is not adhered to. This is usually provided by the manufacturer.
Graphs
The following tabs display the curves that have been fit to the given data. If multiple curves are defined, the Composite Graph tab becomes available. The other graph tabs show the individual curves, along with points representing the raw data. It is a good idea to check that these graphs to confirm the curve fit is reasonable for any potential operating region.
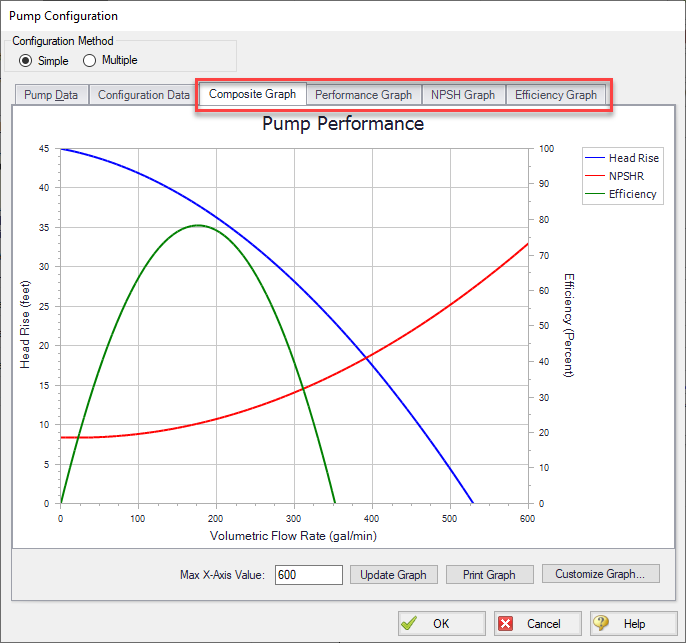
Figure 4: Composite Graph
Related Topics
Centrifugal (Rotodynamic) Pump
Junction X %BEP (Y%) is above/below the POR range
Junction X flow (Y gal/min) is above/below the AOR range (Z gal/min)
Junction X has insufficient pump NPSH/ NPSP…
Related Examples
Related Blogs


