Output Window
The Output window is the primary vehicle for communicating the results of an analysis in text form (see Figure 1). The Output window follows the same general window organization as the Model Data window.
When a model is run, the Solution Progress window appears. After the solution is obtained, you can view the results in the Output window by clicking the View Output button.
If the information in the Output window is not in the desired format, you can choose Output Control from the Tools menu (or Toolbar) to modify the format. The Output Control window lets you specify the parameters, their units, and the order of their display in the Output window.
The Output Print Content window available on the Tools menu (or Toolbar) lets you specify the content to include in the printed Output report and select the font to be used.
The Sort window opened from the Arrange menu (or toolbar) offers the ability to sort the steady-state Pipe Results or Junction Results tables according to the values in any of the columns. Transient results in the Transient Max/Min tables can be sorted using the right-click context menu.
The Transfer Results to Initial Guess feature on the Edit menu (and Toolbar) sets all pipe and junction initial steady-state flows and pressures equal to the converged results, which causes future runs to converge much faster.
You can view the input data for individual pipes or junctions directly from the Output window in one of two ways. First, if you press down the right mouse button on the pipe or junction number in the far left column of the table you will see the Inspection window. Second, if you double-click the pipe or junction number you will open the Properties window in read-only form where you can review input in detail.
General, Pipe, and Junction section display sizes can be changed by the user by clicking and dragging the bars between each section to resize them. Each section can also be hidden by clicking the arrow in the upper left of each section.
You can use the zoom feature in the lower right hand corner of the Output window to resize the text displayed on screen
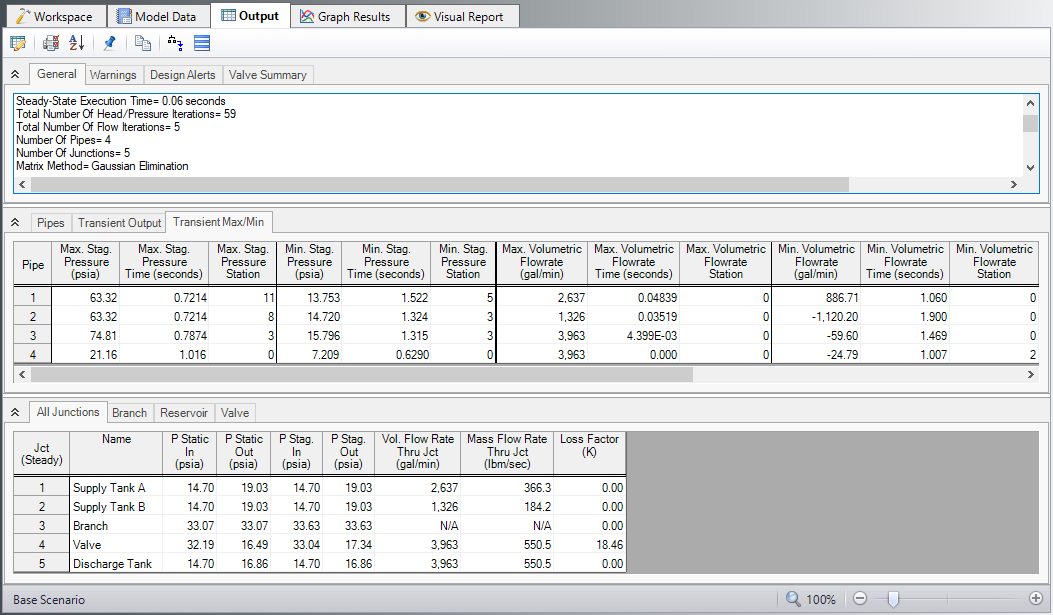
Figure 1: The Output window displays output in text form
Right-click Context Menu Actions
There are several options available when right-clicking on a cell, row header, column header, or entire table in the Output window:
-
Column Header
-
Change Units - Quickly redisplay the selected column in a different unit.
-
Sort - Sort the table in Ascending or Descending order on the selected column.
-
Add "Parameter" for all Table Objects to Excel Export Manager - Add this column to the Excel Export Manager.
-
Open Excel Export Manager - Directly open the Excel Export Manager.
-
Copy Selected Cell Data - Copies all of the values in the column to the clipboard.
-
Row Header
-
Add all Object Parameters to Excel Export Manager - Add this row to the Excel Export Manager.
-
Open Excel Export Manager - Directly open the Excel Export Manager.
-
Find on Workspace - Quickly locate an object on the Workspace.
-
Copy Selected Cell Data - Copies all of the values in the row to the clipboard.
-
Open Properties Window - Opens the properties window for the associated pipe or junction.
-
Table (upper left cell)
-
Add Object Table to Excel Export Manager - Add the entire table to the Excel Export Manager.
-
Open Excel Export Manager - Directly open the Excel Export Manager.
-
Copy Selected Cell Data - Copies all of the values in the table to the clipboard.
-
Cell
-
Add Object "Parameter" to Excel Export Manager - Add this cell to the Excel Export Manager.
-
Open Excel Export Manager - Directly open the Excel Export Manager.
-
Create Design Alert - Create a Design Alert related to the selected object and value.
-
Copy Selected Cell Data - Copies the value of the cell to the clipboard.
Output Window Updates
Whenever you change the input model, all output windows are erased. This prevents you from changing your input model, forgetting to rerun it, and mistaking the previous Output window for the current model's results.
Steady Flow Results
Figure 2 shows the steady flow results in tables for pipes and junctions as specified in the Output Control window.
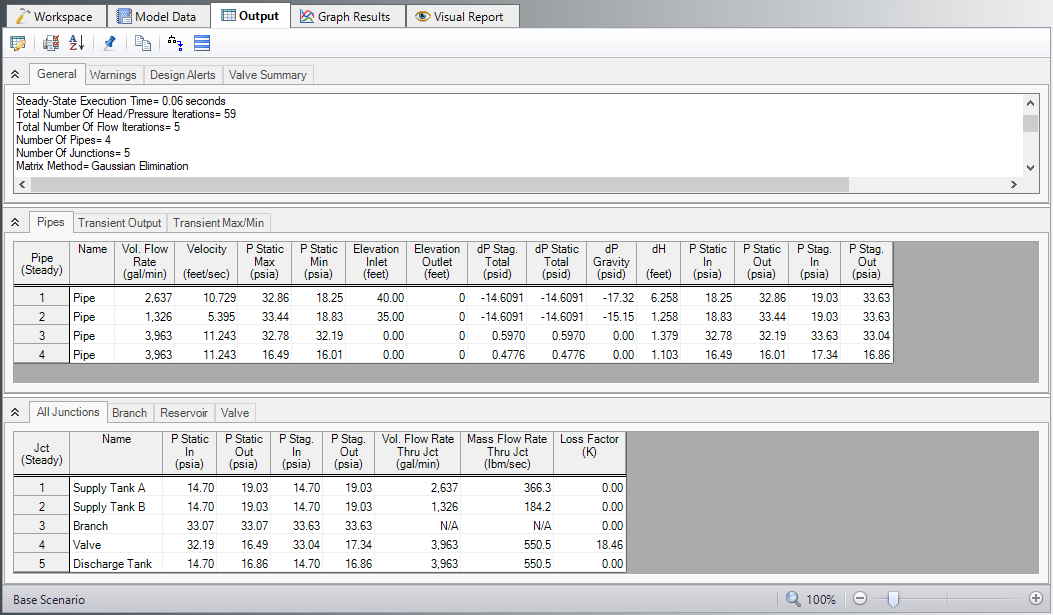
Figure 2: The Output window shows steady flow results in the Pipes table and the various junction tables. Transient data is shown on the transient tabs.
Transient Flow Results for Pipes
You can review the transient results for any pipe station for any time which was saved to file as specified in the Output Pipe Stations panel. These results are shown in the Output window Transient Output table (Figure 3)
Figure 3 shows the transient flow results at the initial time step (which is equal to zero here). The columns of data shown in Figure 3 are specified in the Output Control window. Using the Time Slider will change what time step results are displayed.
Note that the pipe stations shown are those saved to the output file.
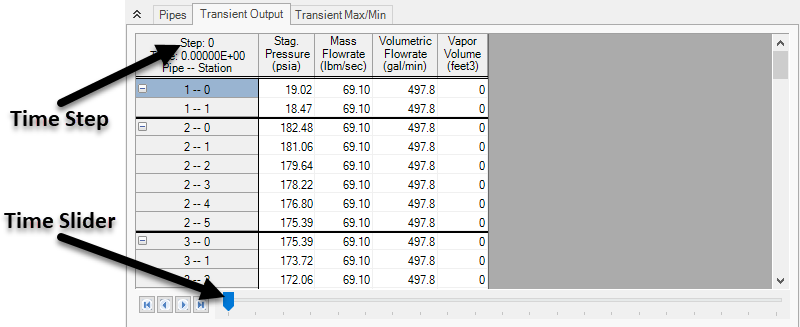
Figure 3: The Transient Output table in the Output window shows output results for pipe stations and at specified times.
Transient Max/Min Results
The Transient Max/Min table in the Pipe Output section shows the maximum and minimum values for each parameter in each pipe, the time it occurred at, and the station it occurred at. Thus, for each transient parameter added in the Output Control window, 6 columns will be shown in the Transient Max/Min table. Figure 4 below shows an example.
The default format of the Transient Max/Min table is the summary version, showing the maximum and minimum values for the whole pipe, as described above. A detailed format is also available, where the maximum and minimum values for each parameter at each station are shown, along with the time they occurred at. Thus, for each transient parameter added in the Output Control window, 4 columns will be shown in the Detailed Transient Max/Min table. Figure 5 below shows an example.
The Output Control window, under the Format & Action tab can be used to switch between the detailed and summary views.
The information shown in the Transient Max/Min tables is not dependent upon what pipe station and time step output is saved for a given simulation.
![]()
Figure 4: Summary version of the Transient Max/Min table
![]()
Figure 5: Detailed version of the Transient Max/Min table
Transient Event Messages
When events occur at junctions during the transient simulation, a log of all events is displayed in the two Event Message lists. In the first list events are sorted by junction number. In the second list they are sorted by time. The list includes when check valves close (and re-open), relief valves open (and re-close), control valves lose control (and regain it), as well as all standard event transients.
Results Diagram
Results diagrams are available for steady state pump results (see Figure 6). These diagrams allow you display the information in a more intuitive manner, copy the image of the diagram to your clipboard, or print the diagram. The option to show the results diagram can be found in the pump summary tab.
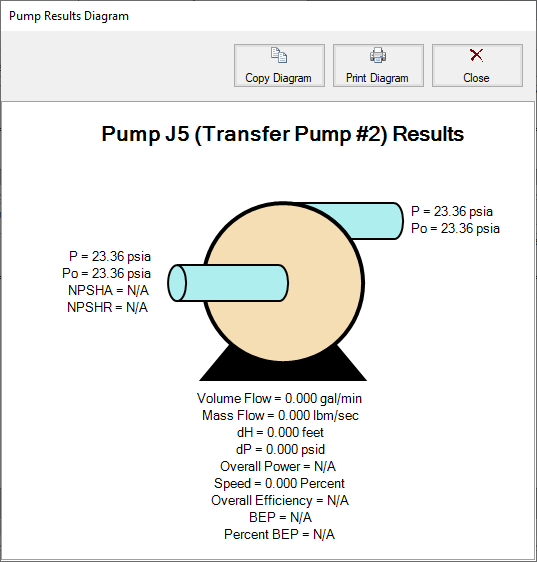
Figure 6: Pump Results Diagram
Printing and Exporting
Data in the Output window can be:
-
Copied to the clipboard
-
Saved to a formatted text file
-
Exported to a delimited file suitable for direct importing into spreadsheet software
-
Exported directly to Excel
-
Saved directly to an Adobe PDF file
-
Sent to the printer
The printed and Adobe PDF output follows the same flexible, organized, and accessible format as the Output window itself.


