PAT Operation While Decoupled
Operation as a Turbine means the PAT is coupled to the motor, but the PAT can also operate while decoupled from the motor, meaning the pump’s impeller is spinning freely in the fluid stream. The PAT will be decoupled from the motor when it is operating below the No Load point (the flow rate with zero power generation) on the Turbine Curve, since below that flow rate the motor would be required to input power to the system.
Figure 1 below shows these operating conditions. Since the PAT is decoupled from the motor, the generator does not impart a torque on the pump impeller to counteract the torque applied by the fluid, and the pump impeller becomes free-spinning. When the free-spinning impeller reaches a steady-state speed, no torque is imparted on the impeller by the fluid. This speed is called the runaway speed.
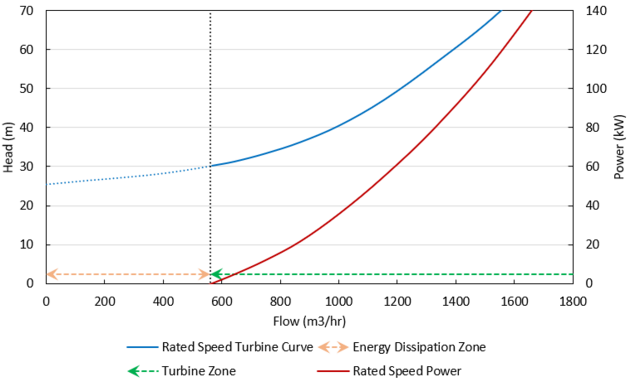
Figure 1: General Turbine Operating Conditions
The pressure loss of a free-spinning PAT is determined by the Turbine Performance curve, adjusted by the pump Affinity Laws. The user-defined Rated Turbine Speed is considered 100% speed, and the Affinity Laws are used to adjust the curve based on speed. The Affinity Laws adjust the Turbine Performance curve in the same direction they adjust a Pump Performance curve (i.e., head loss and power increase with impeller speed).
The speed of a free-spinning impeller is determined by the following equation. Here time step i is the current time step, i+1 is the next time step, N is the impeller speed (in RPM), P is the power imparted on the impeller by the fluid, and I is the total rotating inertia of the PAT impeller and shaft.

The power term is always dictated by the Turbine Power Curve, adjusted using the Affinity Laws for speed. When the decoupled PAT nears runaway speed, the PAT approaches the No Load point (flow rate where the power curve is equal to zero) and power approaches zero. Thus, the speed does not change from time step to time step.
No Load Curve
Each runaway speed of the PAT has a different No Load point, meaning a No Load curve can be created to describe how head loss is related to flow across the range of potential runaway speeds. Each point on the curve represents a different runaway speed and different steady state. Figure 2 below shows an example No Load curve overlaid with a Turbine Performance Curve and a Turbine Power Curve. Notice how the No Load curve intersects the Turbine Performance Curve at the point where the Turbine Power Curve has zero power.
This No Load curve can be created by plotting the head loss for multiple Turbine Performance Curves (adjusted for speed) at the flow where their corresponding Turbine Power Curves cross the zero power line. Note that Impulse does not calculate, use, or require the No Load curve for its calculations. Rather, the No Load curve is merely an observable consequence of the physics the PAT follows.
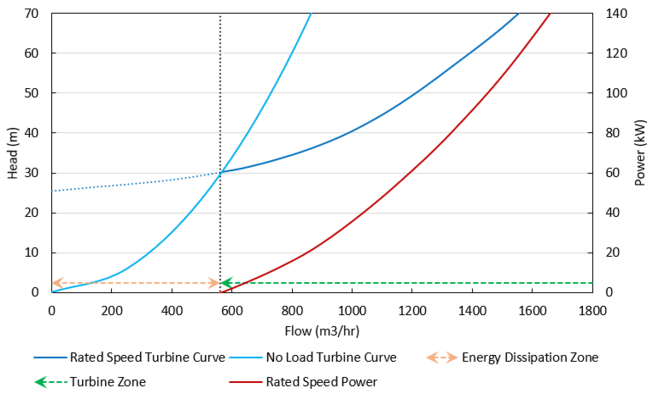
Figure 2: Example No Load Curve showing general turbine operating conditions.
Related Topics
Related Blogs


