PFA Pump RPM Evaluation
The various pump speeds that excite frequencies of interest selected by the user are automatically calculated. These speeds are displayed in the Pump RPM Evaluation Panel labeled "Excitation Frequencies and Pump Speeds" that will appear in the Quick Access Panel when the Graph Results window is active and frequencies of interest have been specified. Instructions to evaluate excitation frequencies using AFT Impulse PFA are available when clicking on the question mark icon in the Pump RPM Evaluation Panel. The corresponding pump speeds that will excite the frequencies being evaluated are displayed on this panel, and speeds of interest can be selected automatically to create child scenarios using those pump speeds. Figure 1 below shows the location of the Pump RPM Evaluation Panel that allows you to specify pump speeds you would like to evaluate after generating an Excitation Frequency Analysis graph.
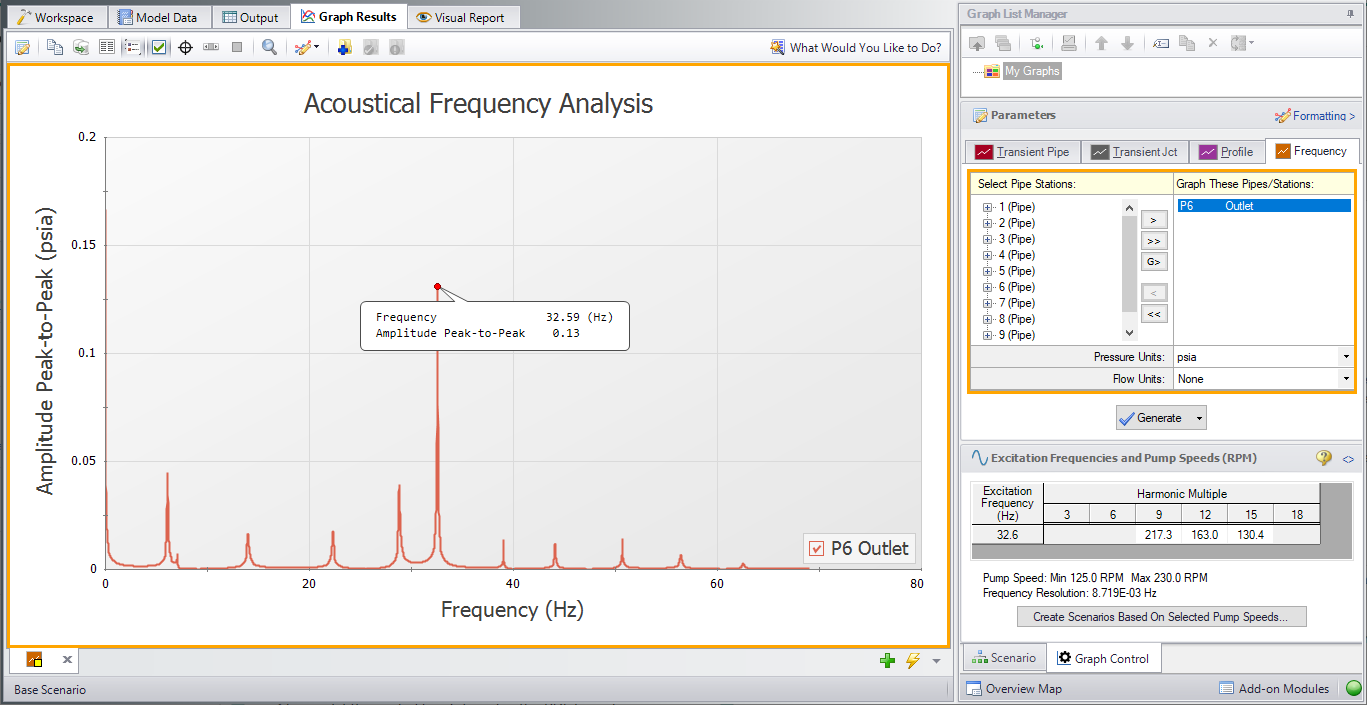
Figure 1: The Graph Results window with the Quick Access Panel and the Pump RPM Evaluation Panel
Note that the Frequency vs. Magnitude graph can also be displayed with the magnitude on a logarithmic scale. To change this graph to display the magnitude on a logarithmic axis, right-click on either axis and check the box under Logarithmic.
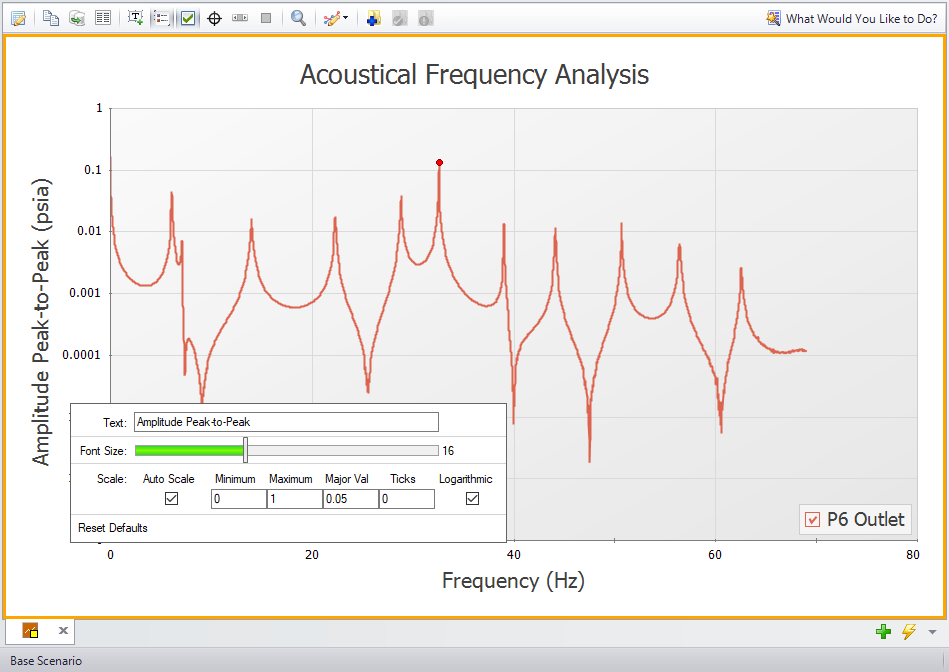
Figure 2: The Magnitude vs. Frequency Graph with the magnitude on the y-axis displayed on a logarithmic scale
After the steps needed to generate an Excitation Frequency Analysis graph have been taken, you can analyze frequencies of interest. Large peaks on Excitation Frequency graphs correspond to natural acoustic frequencies of the system. The numerical “hammer” provided by the initial pulse has helped to identify the response of the system. By clicking and dragging from one side to the other over particularly high peaks and releasing the mouse button, the frequency in this area with the largest magnitude will be selected. Right-clicking on the label that appears enables you to add the frequency to the excitation frequencies being evaluated by selecting "Evaluate Excitation Frequency", as shown in Figure 3.
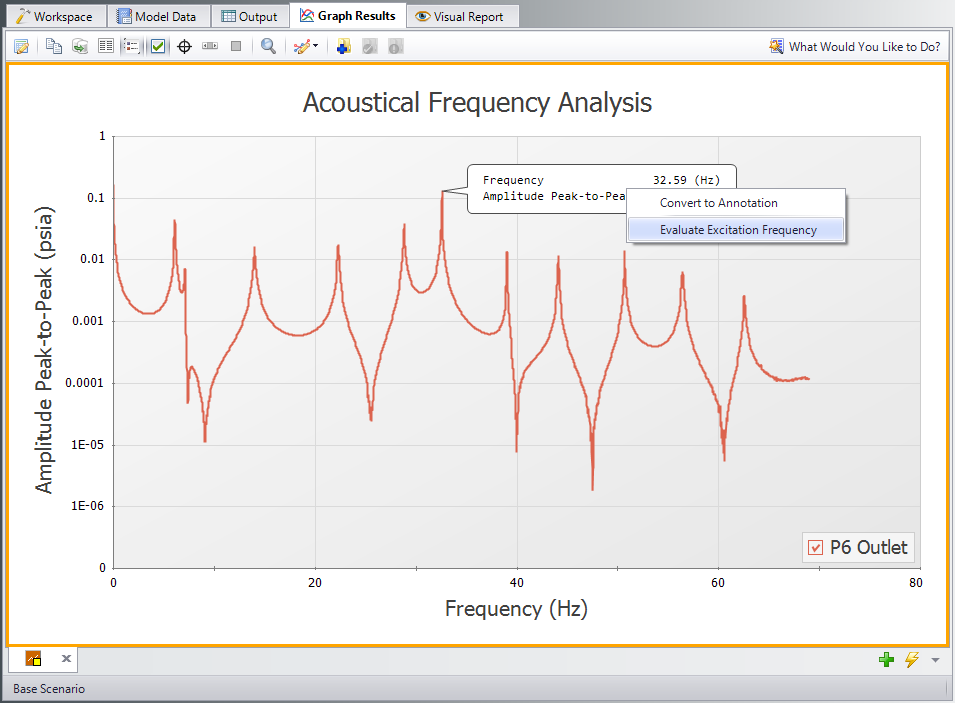
Figure 3: Right-click on the flag of the selected frequency to evaluate it
It is important to identify these natural frequencies to make informed decisions about operation. Operating at pump speeds that will excite these natural frequencies for extended periods of time can cause system fatigue and structural issues attributed to vibrations. These are commonly referred to as ‘worst-case’ pump speeds because they match up with the harmonic frequency of the system and cause the most vibrations when operating at that frequency. Figure 4 shows the instructions which can be accessed by clicking on the question mark icon on the top right of the Pump RPM Panel of the Quick Access Panel, which is indicated in Figure 1.
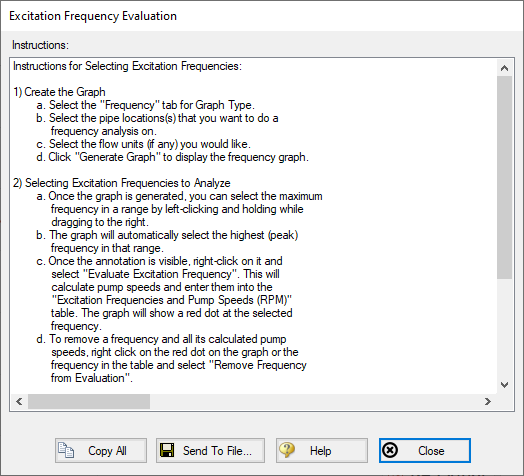
Figure 4: Detailed Instructions to evaluate excitation frequencies and determine problematic pump operating speeds
In order to determine what pump speeds will excite the natural frequencies that are selected, Equations 1 and 2 are used (Blanding & Walters, pp. 7-8).
|
|
(1) |

Equation 1 identifies the various pump speeds for which integer multiples align with the natural frequencies.
-
 , corresponding pump speed that will excite the given natural frequency
 -
 , selected natural frequency that is being evaluated
 -
 , run-speed multiple, referred as the harmonic multiple

Equation 2 is used to calculate the harmonic multiple where:
-
 , the number of plunges per revolution, equal to the number of PD pump heads
 -
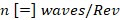
 integer harmonic multiplier
The integer harmonic multiple corresponds to harmonic numbers of the selected natural frequency. Note, the Nij decreases hyperbolically as s increases. Figure 5 shows the 'worst-case' pump speeds that correspond to the natural frequency (32.6 Hz) being evaluated.
Figure 5: The Pump RPM Evaluation Panel with the pump speeds determined to excite evaluated frequencies
After the PD pump speeds are calculated, read-only scenarios are created by clicking the "Create Scenarios Based On Selected Pump Speeds" button. You can specify which pump speed(s) you want to make into a child scenario by clicking on any speeds you want to exclude. AFT Impulse PFA will then create and populate child scenarios to evaluate the selected pump speeds. For each child scenario Impulse PFA will calculate and define transients in the specified pulsation source junction that are based on the pump speeds displayed in Figure 5. Running the scenarios will determine the actual pressure response of the system at these frequencies, which can be evaluated with API-674.
References
-
Blanding, James M., Ph.D., and Trey Walters, PE. Pulsation Analysis in Positive Displacement Pump Systems Using Waterhammer, Modal, and Animation Software. Houston, TX: 45th Turbomachinery & 32nd Pump Symposia, Sept. 2016. http://www.aft.com/documents/TechnicalPapers/2016/TPS2016-PulsationAnalysis.pdf


