Visual Report Window
The Visual Report will help you visualize the model data and flow solution in relationship to the model layout. The Visual Report window displays the pipe system layout from the Workspace window with information in text form (see Figure 1). Additionally, relative magnitudes of parameters may also be shown with color variations using color maps, or animated using Visual Report Animation.
The values to be shown may come from the input data (when in input mode), the steady-state output or transient output results. You can change between these by selecting the option at the top of the Visual Report Control window.
In the Visual Report window, the positions of the junctions and pipes are fixed based on their locations on the Workspace. While the pipe system layout cannot be edited in the Visual Report window, the integrated text results for each pipe or junction can be rearranged by dragging and dropping to improve the final appearance of the window.
The contents of the Visual Report window can be:
-
Copied to the clipboard
-
Saved to a picture file
-
Saved directly to an Adobe PDF file
-
Sent to the printer
Visual Report animations can be recorded to a .wmv or mp4 file.
The controls in the lower-right corner allows you to zoom in and out, as well fit the image to the size of the screen. The printed size is consistent with the zoom state. That is, if you zoom out to 50%, the Visual Report screen prints at 50% of its normal size.
The Visual Report window is always erased when you make changes to model input. If viewing output results, rerun the model to view the new results.
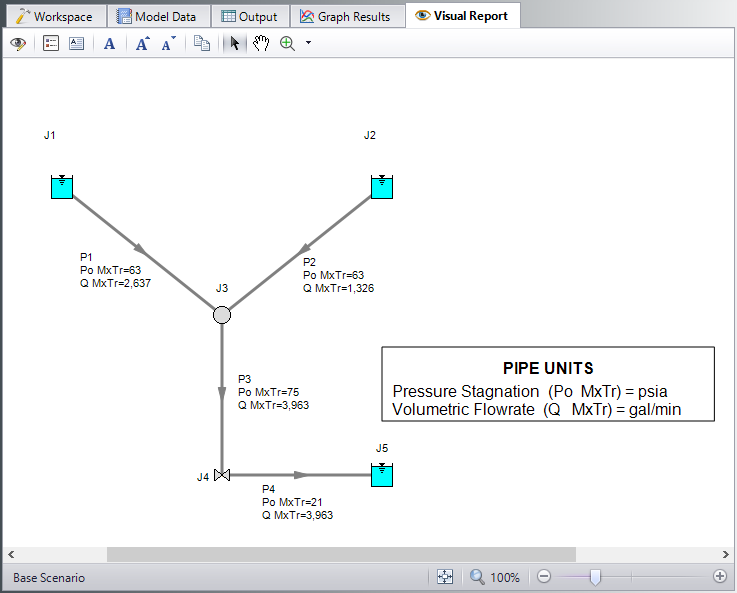
Figure 1: Visual Report window integrates input data and output results with model layout
Related Blogs


