Animating Visual Report Results
Animating the results of a transient run is an extremely powerful way to understand how a complex system is behaving. While transient plots of fluid parameters over time at a given location are valuable and easy to interpret, they do not directly convey the most important aspect of a fluid transient event - how the pressure and flow waves propagate through a system and interact with one another. Animating the results of a transient simulation allows you to observe these effects directly.
Unlike the Graph Results Animation feature, Visual Report Animation provides the added benefit of being able to observe how waves propagate through branching paths and similar situations which are not restricted to one continuous flow path.
Saving Output for Animation
The Visual Report Animation feature works by referencing the output for each computational pipe section in the animated pipes. In order to accomplish this, data for each pipe station being animated must be saved to the output file. By default, Impulse will only save the data for the inlet and outlet pipe stations. To change this the settings will need to be adjusted to save All Stations for the pipes being animated by, which can be done in the Output Pipe Stations panel in the Pipe Sectioning and Output group.
Note: Saving data for all stations will slow down the model run time, and may require a very large output file. To save time, it is recommended to save output only for the pipes which will be animated.
Creating an Animation
To enable animation in the Visual Report, The Display Mode will need to be set to "Animate" in the Visual Report Control window.
When Animate is selected, the following Animation Settings become available.
-
Data Type
-
Absolute Values - This option directly uses the transient values for the pipes being animated. Impulse will then automatically generate evenly spaced values in between the absolute minimum and maximum which will be displayed on the color scale.
-
Relative Changes - This option displays the changes in the transient results relative to the steady state values in order to animate the delta throughout the run. Impulse will determine the maximum and minimum changes from the steady state, then automatically generate evenly spaced intervals between these values to display on the color scale.
-
Maximum Values - This option does not animate the data, but instead colors the pipes based on the maximum values during the transient for each of the pipe stations.
-
Minimum Values - This option does not animate the data, but instead colors the pipes based on the minimum values during the transient for each of the pipe stations.
-
Parameter to Animate - The parameter and units for the animation can be selected
-
Auto Scale - If this box is checked, Impulse will automatically choose the maximum and minimum values for the selected parameter to assign the color scale for animation. This box is checked by default.
-
Maximum - The maximum value for the color scale can be changed here if the Auto Scale box is unchecked
-
Minimum - The minimum value for the color scale can be changed here if the Auto Scale box is unchecked
-
Smooth colors between pipe sections - This choice sets the color gradient on the Visual Report to be displayed as a smooth transition, rather than an abrupt transition in color.
-
Borders between pipe sections - This choice displays lines on the pipes to explicitly delineate the sections. This can only be enabled if the smooth colors option is disabled.
-
Pipe Thickness - This option adjusts the thickness of the colored animation pipes. The thickness of the original pipes can be adjusted in the Pipe Properties window on the Optional tab.
-
Junction Size - This option allows the size of the junctions in the Visual Report window to be adjusted for the animated model. The junctions can also be set to 0% to automatically hide all junctions. This sizing will only be applied on the Visual Report window.
-
Use Lines for Junctions - This option allows the junctions to be represented as bold lines instead of symbols as an alternate method of displaying the junction locations.
-
Defaults - This button allows the user to reset the Visual Report Animation settings to the defaults.
It should be noted that once the animation settings have been changed for a scenario, those settings will be retained even if the scenario is re-run. Each scenario can retain different Visual Report Settings if desired; however, there is no way to save multiple Visual Report configurations within the same scenario.
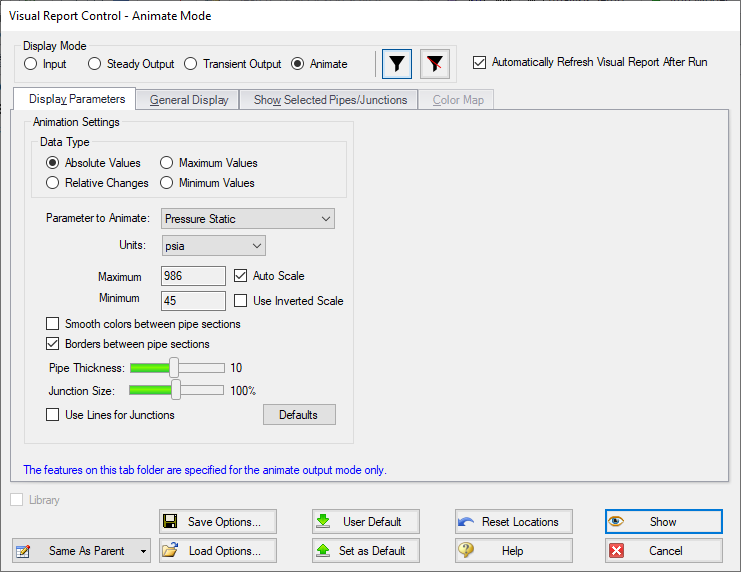
Figure 1: Options for the Animate display mode in Visual Report Control
Viewing Animation
Once the Visual Report Control Settings have been configured and the visual report has been shown, several animation-specific components will appear, including the animation toolbar and Visual Report Animation tab, as shown below.
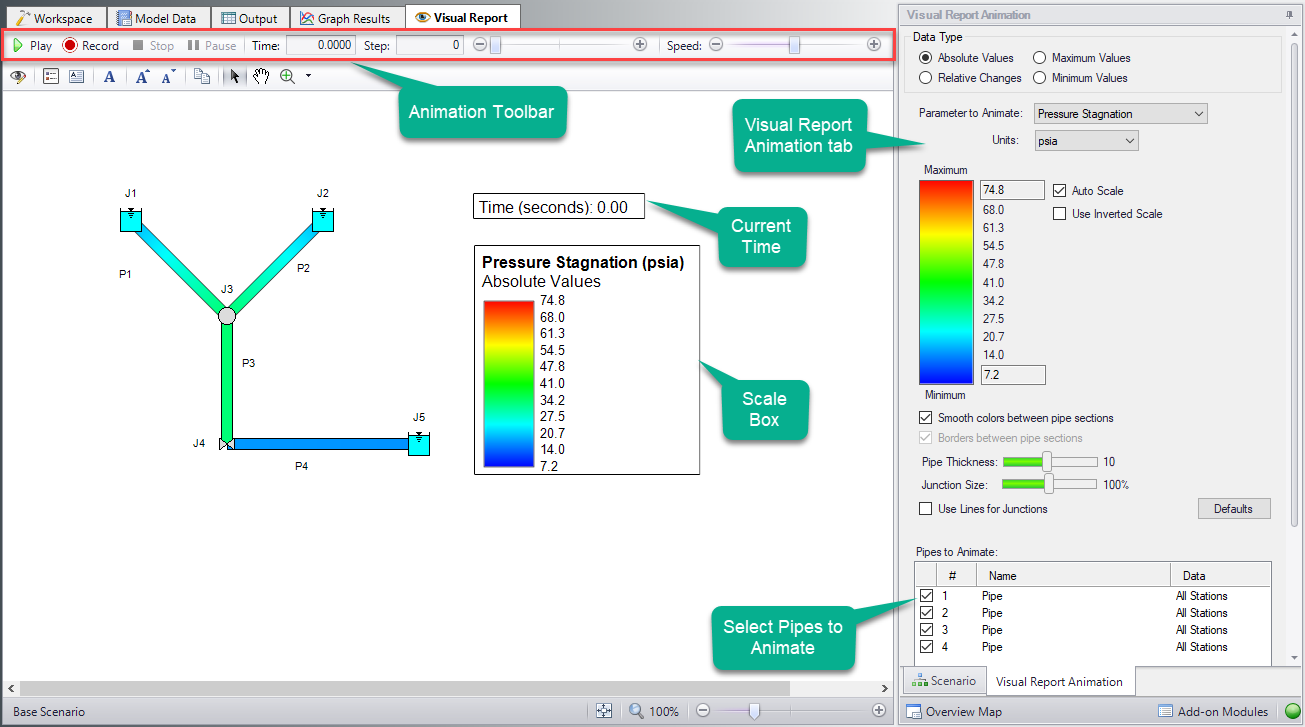
Figure 2: Components added to the Visual Report window when using the animation display mode
The Visual Report Animation tab in the Quick Access Panel provides quick access to the Animation Settings from the Visual Report Control window, as well as allowing the user to select which pipes will be enabled for animation. When disabled, the pipe will simply be shown using the workspace settings. Pipes that are not being animated can be hidden in the Visual Report Control window on the Show Selected Pipes/Junctions tab.
The animation toolbar has several controls:
-
Play - Start the animation from the current time.
-
Record - Begin playing the animation from the current step, and when the playback is stopped, prompt the user to save an .mp4 video recording of the animation to file.
-
Stop - Halt the animation and reset the time to zero.
-
Pause - Pause the animation at the current time.
-
Time - The actual simulation time of the currently displayed data.
-
Step - The simulation step of the currently displayed data.
-
Time/Step slider - Seek for a certain point in the animation.
-
Speed slider - Change the speed of the playback.
-
Default - Reset the speed to default.
The Current Time box and Scale can be moved anywhere within the Graph area.
Using Animations to Interpret Behavior
There are many ways that animations are helpful in interpreting behavior. Below, we consider the simple case of a valve closure.
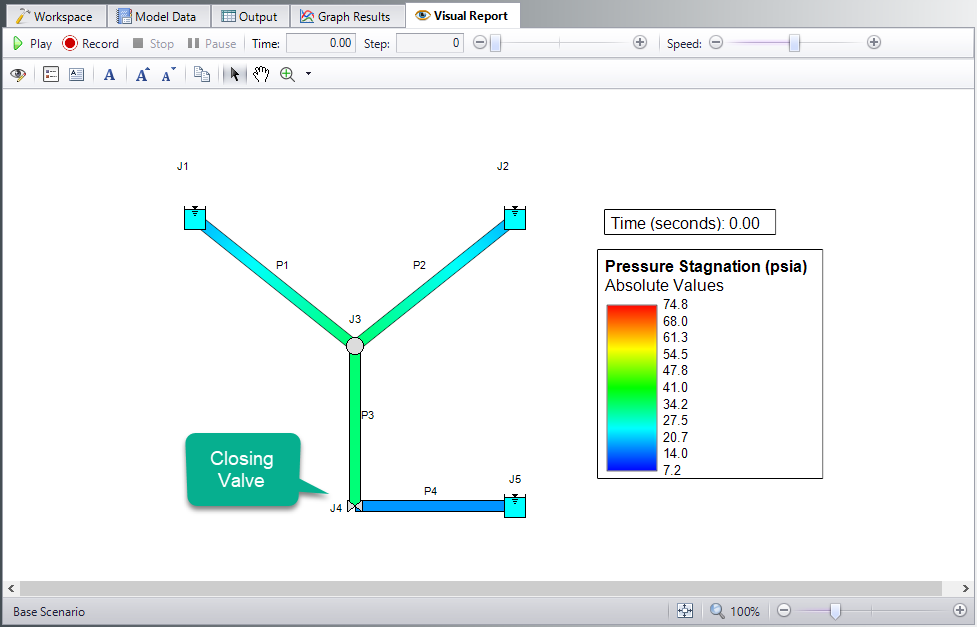
Figure 3: Visual Report animation showing steady-state (time step zero) results
Figure 4: The movement of the wave within the pipe can be directly visualized


