Calculating for a Range of Points
|
SteamCalc allows the user to generate a table of output values. To generate a table of values, select the Range tab.
The first input property must be specified as a fixed value. The second property value is specified as a range of values, with a start value, an end value, and an increment size.
The range values are displayed in a shaded column at the left edge of the output table. The name, value and unit for each property selected for display in the Output Control window is listed in the output display. Scroll bars are displayed if the table extends beyond the window area. Figure 8 shows an example of the input and output for a range calculation.
When creating property tables using property ranges, a graph of the output property data can be created by selecting Create Graph from the Options menu, or by selecting the Create Graph button from the toolbar.
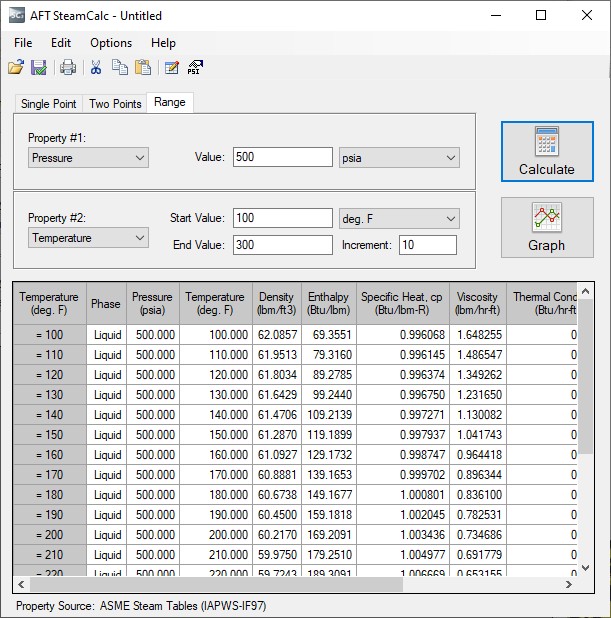
Figure 8: Input and Output for a range calculation.