Graph Annotations
Graph Annotations are objects that can be placed on the Workspace to display graphical results directly in the model space. This is done by combining properties of the Annotation object and Graph Results Window. By drawing graphs directly on the Workspace, this provides immediate visualization of important parameters with a side-by-side view next to the model of the piping network.
Graph Annotations are created using the Graph Annotation Tool in the Toolbox. The Graph Annotation Tool is located below the Pipe Drawing Tool. With this tool, the user can draw a box that can graph various parameters directly on the Workspace.
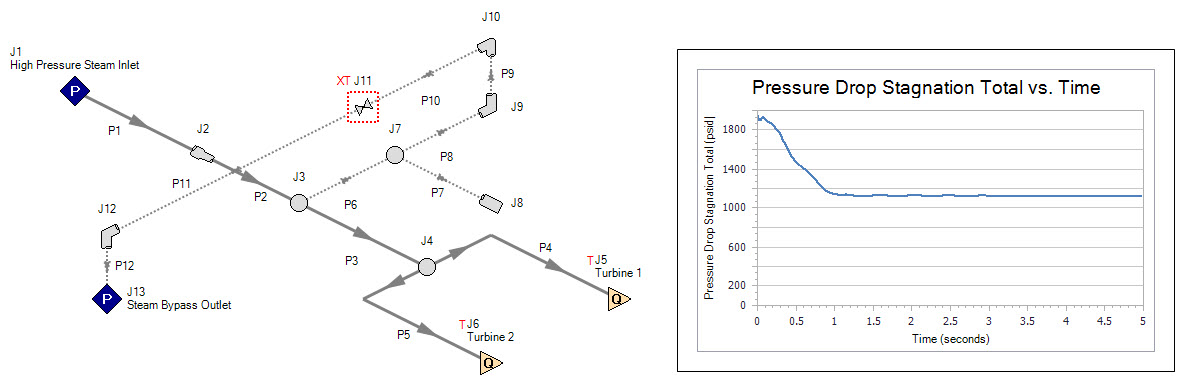
Figure 1: Graph Annotation Used on the Workspace
Graph Control
While a Graph Annotation is selected on the Workspace, a new tab on the Quick Access Panel will be visible called the Graph Control tab. Here, the graph setup and formatting properties of the annotation can be edited.
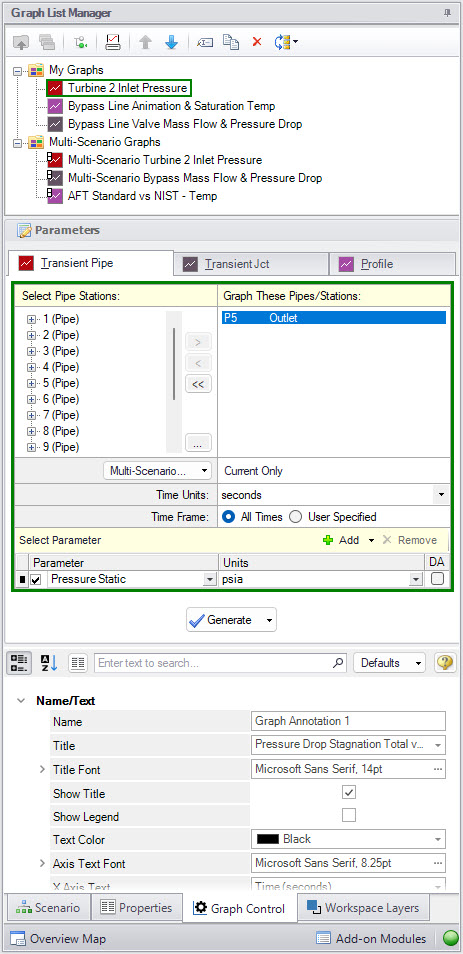
Figure 2: Graph Control Tab in the Quick Access Panel while a Graph Annotation is selected
The Graph Control tab incorporates aspects from the Graph Results window for graph setup and Properties configuration for the standard Annotation object. This tab is separated into three sections: the Graph List Manager, the graph Parameters, and the annotation properties.
-
Graph List Manager - Regenerate graphs that have already been saved from the Graph Results window. Incorporates the same options as the Graph List Manager found on the Graph Results window. For additional options, see the Graph List Manager section on the Graph Results page.
-
Parameters - Define the Graph Type, select the objects to graph, select parameters, and select Generate to generate the plot on the annotation. Nearly all of the same functionality of standard graphing from the Graph Results window can be performed through the Graph Annotation outside of creating stacked graphs and plotting animations with Profile graphs. For further information on available Graph Types and additional options in this section, see the Graph Types page.
-
Annotation Properties - The annotation text styling and formatting can be customized in the bottom section of the Graph Control tab. Here, subsections exist to display the different styling and formatting options available.
-
Name/Text - Provides control over the title, text sizing, legend, font, color, and axis customization
-
Scaling - Controls the X, Y, and dual Y-axis range
-
Format - Configures the border formatting
-
Behavior - Provides some additional options for the behavior of the Graph Annotation
-
Scenario - Provides the ability to select which scenarios the Graph Annotation is visible in
-
Graph Annotation Behavior on the Workspace
On the Workspace, the Graph Annotation will plot the results after the model has been run and the graph has been configured and generated. When results do not exist, a red exclamation mark will appear on the annotation indicating the plot cannot be generated without results. When the model is re-run, the graph will automatically replot the results. This behavior can be updated in the Behavior subsection of the Annotation Properties section in the Quick Access Panel by unchecking the option for Replot After Run. This will instead provide a Replot button directly on the annotation for manual regeneration of the graph. This can be helpful when frequent changes are being made to the model by saving loading time generating the plots on the Workspace when the plot is not immediately needed.
Selecting the Graph Annotation on the Workspace will highlight the associated objects being graphed aiding in identifying which objects from the model are being represented within the graph. This option can be toggled in the Behavior subsection of the Annotation Properties section in the Quick Access Panel by unchecking the option for Highlight Constituent Objects.
A crosshair can be enabled from the Behavior subsection of the Annotation Properties section in the Quick Access Panel by checking the option for Show Crosshair. When the crosshair is enabled, while hovering over a plotted graph a vertical line will be shown indicating where the crosshair is currently located on the graph. While the crosshair is over a traced plot, a pop-up will list the X and Y value at the intersection between the crosshair’s vertical indicator and the plot. This can be convenient to quickly identify a point on the graph without needing to move to the Graph Results window. The crosshair is off by default.
Right-clicking on the Graph Annotation provides some additional menu options.
-
Copy X-Y Data - Copies the X-Y used by the Graph to the clipboard
-
Generate in Graph Results - Generates the same graph from the Graph Results window
-
Load From Graph List Item - Load a saved Graph List item
-
Quick Formatting - Open the Plot Line Formatting window to customize the legend text, line colors, line styles, and line thickness
-
Reset to Default Scaling - Resets any changed axis scaling back to default ranges
-
Save as Graph List Item - Saves the graph to the currently active Graph List allowing it to be regenerated in the future