Sonic Choking Detailed Description
Sonic choking occurs when some location in the pipeline experiences a local velocity equal to the sonic velocity of the gas. Sonic choking can occur in three geometric configurations in a pipe system. Figure 1 depicts the three possibilities.
The first case can be called endpoint choking because it occurs at the end of a pipe as it exits into a large vessel or the atmosphere. In this situation, the gas cannot drop its pressure to match that at the discharge without accelerating to sonic velocity. A choke point forms at the end of the pipe, which results in a pressure discontinuity across which the discharge pressure condition is met.
The second case can be called expansion choking, and is similar to the first case. Expansion choking can happen when the flow area of the pipe is increased rapidly. For example, this occurs when the pipe is expanded from a two inch pipe to a three inch pipe. Another example is when a pipe enters a flow splitter where the sum of the pipe areas on the splitting side exceeds the pipe area of the supply pipe. A choke point forms at the end of the supply pipe, and a pressure discontinuity is established.
The third case can be called restriction choking. This can occur when the gas flows through a restriction in the pipe such as an orifice or valve. In such a case the flow area of the gas is reduced, causing a local increase in velocity which may reach the sonic velocity. A choke point forms at the restriction, with a pressure discontinuity similar to the first two cases.
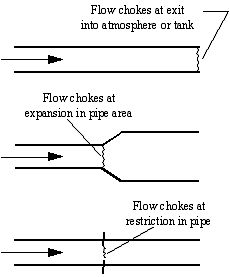
Figure 1: Three configurations which can result in sonic choking. From top to bottom, endpoint choking, expansion choking, and restriction choking.
Figures 2-4 show example stagnation pressure and Mach number profiles for the three cases. The data for the cases are: Supply air at 100 psia and 1000° R discharging to 30 psia, with Figure 2) 2 inch pipe with no restrictions or expansions, Figure 3) 2 inch pipe expanding to 3 inches at the midpoint, Figure 4) all pipe is 2 inch with orifice at midpoint with 0.6 area ratio. Mach number spikes to 1 at the orifice then reduces to 0.29 immediately after. For clarity this spike is not shown.
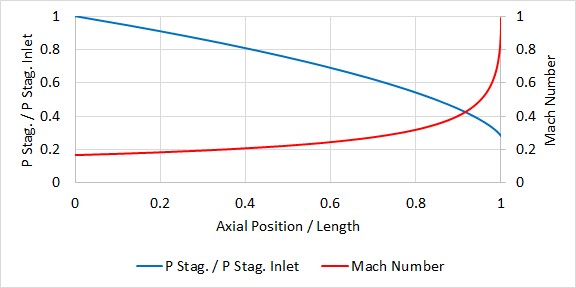
Figure 2: Example stagnation pressure and Mach number profiles for endpoint choking
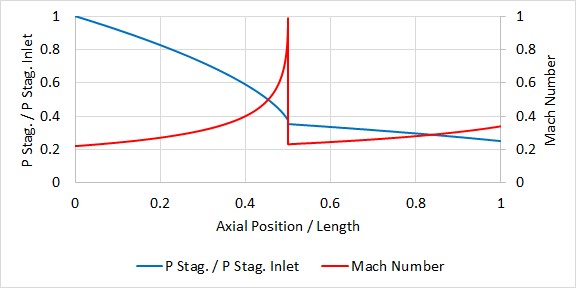
Figure 3: Example stagnation pressure and Mach number profiles for expansion choking
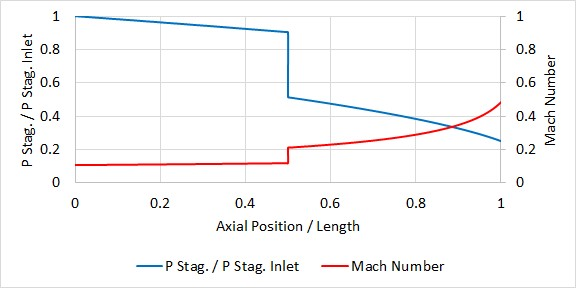
Figure 4: Example stagnation pressure and Mach number profiles for restriction choking. Note that the Mach Number reaches 1 within the restriction at 0.5.
The choked flow rate can be determined from Equation 50 by inserting a Mach number of 1 in Equation 51. These equations can be derived from the continuity equation (Saad, 1993Saad, M.A., Compressible Fluid Flow, 2nd Edition, Prentice-Hall, Englewood Cliffs, NJ, 1993, pp. 97):
|
|
(50) |

where:
|
|
(51) |

In practice it is difficult to apply Equation 50 to choked conditions because the local conditions, Po, and To, are not known at the point of choking. For instance, to apply these equations to endpoint choking (Figure 1, top), one must calculate the stagnation pressure and temperature at the end of the pipe before the choke point. The problem is that the stagnation pressure and temperature before the choke point depend on the flow rate, which is what we are trying to calculate.
The only way to accurately calculate such a problem is to do the following:
-
Assume a flow rate
-
March down the pipe
-
If the Mach number reaches unity before the end of the pipe, lower the assumed flow rate and repeat steps 1-3 until the Mach number reaches sonic right at the pipe endpoint.
The area, A, in Equation 50 can also be CdA, where the Cd is less than one and accounts for area reductions due to flow separation. This occurs in orifices, valves and other internal restrictions. Note that the Cd used here is not equivalent to the discharge coefficient used for subsonic flow calculations. See Subsonic vs. Sonic Pressure Losses for more information.
A helpful output parameter in AFT Arrow is the sonic area, which can be compared against actual area to determine what CdA would cause choking at a restriction:
|
|
(52) |

A CdA smaller than the sonic area indicates that the flow would be choked. The sonic area is one of the output parameters.
Sonic Choking Effects
The effect of sonic choking in pipe design or operation is that the maximum physically possible pipe flow rate has been reached for the supply conditions. Lowering the discharge pressure will not produce more flow rate. Figure 5 illustrates this by showing the flow rate as a function of discharge pressure in a two inch pipe carrying air. This pipe does not have any restrictions, and experiences endpoint choking at any discharge pressure below 63.6 psia.
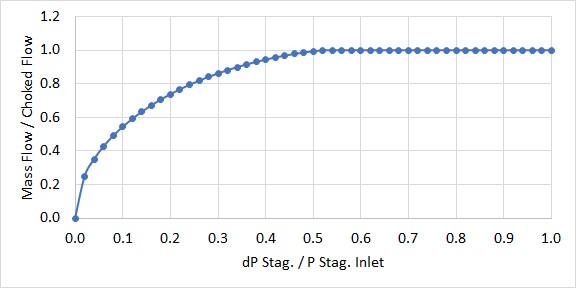
Figure 5: Example of dimensionless flow rate vs. dimensionless pressure drop. Sonic choking occurs just past the dimensionless pressure drop of ~0.5, after which the flow can no longer increase
Some engineers misapply the concept of sonic choking and conclude that the sonic flow rate is the maximum possible through the pipe for all conditions. This is not the case. If the supply conditions can be increased, the flow rate through the pipe can be increased. In fact, the increased choked flow rate appears to increase linearly with increased supply pressure. See Figure 6.
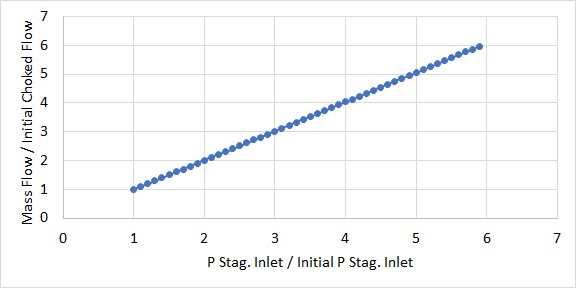
Figure 6: Example of increasing choked flow rate with supply pressure
The pressure drop across the choke point in choked flow cannot be calculated directly. Methods such as "normal shock tables" do not apply. The only way to calculate the pressure drop is to use the choked flow rate as a new boundary condition on the pipe downstream of the choke point and apply the governing equations to the remaining pipes. This boundary condition is facilitated by knowing the stagnation enthalpy change across the choke point is constant.
Finally, a pipe can choke in more than one location. This occurs when the choked flow rate determined by the first choke point is applied to the pipes downstream of the shock wave and the gas at this flow rate cannot reach the end of the pipe without experiencing another shock wave. There is no limit to the number of choke points in a pipe other than the number of possible geometric configurations it contains which may cause sonic choking.
The three mechanisms that cause choking can all occur in the same pipeline in any combination and any order.
See Walters (2000)Walters, T.W., "Gas-Flow Calculations: Don't Choke", Chemical Engineering, Chemical Week Associates, Jan. 2000, pp. 70-76. and Walters and Olsen (1997)Walters, T.W., and J.A. Olsen, "Modeling Highly Compressible Flows in Pipe Networks Using a Graphical User Interface," ASME International Joint Power Generation Conference, Denver, CO, 1997.. for more information.
Related Topics
Subsonic vs. Sonic Pressure Losses
Multiple Choking Points in Single Flow Path
Related Examples