XTS Animating Results
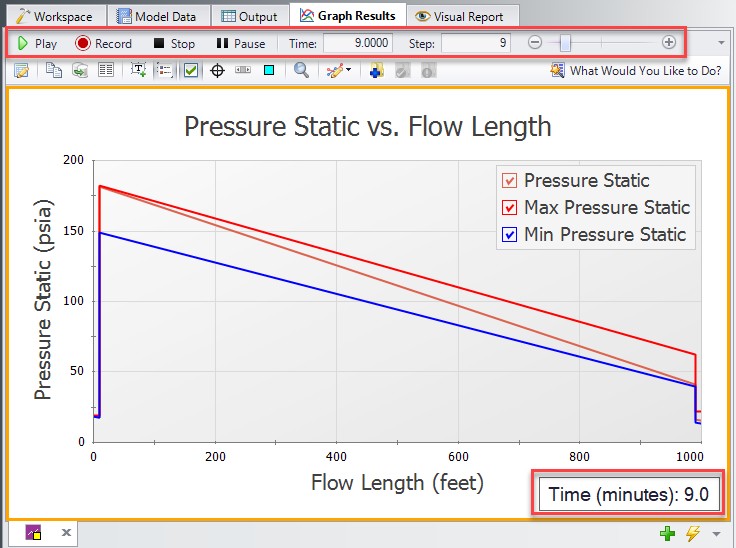
Figure 1 shows the Graph Results window when using animation. As shown, additional controls become visible to allow the user to adjust animation. At the left is the Play button, which starts the animation. Next to it are the Pause and Stop buttons. If the Pause button is pushed, the animation stops at that time step. One can print the graph or copy the data if desired or use the time slider controls (to the right of the Stop button) to set the time forward or backwards. The Stop button stops the transient and resets the time to zero.
The current time (in seconds) and time step are shown to the right of the time controls. At the far right are the speed controls. Slowing the animation involves adding time delays to the data display. Increasing the speed involves skipping time steps. The default speed, right in the middle, has no delays or skips.
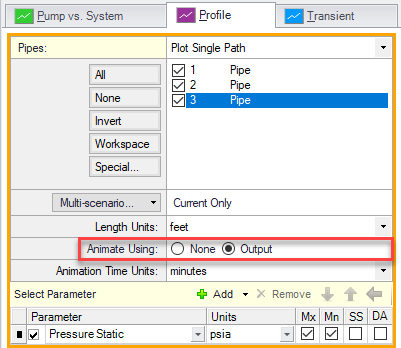
If plotting a single path using the list of pipes in Graph Control (Figure 2), one can cross-plot on the animation design alerts (in Profile Along a Flow Path) or steady-state results (in EGL, HGL and Elevation Profile).

Figure 1: The animation options display additional controls

Figure 2: Enabling Animation in Graph Control


