XTS Quick Graph
(XTS Module Only) Transient output data displayed in the Output window can be graphed by right-clicking on the data in the table and selecting Quick Graph (see Figures 1 and 2).
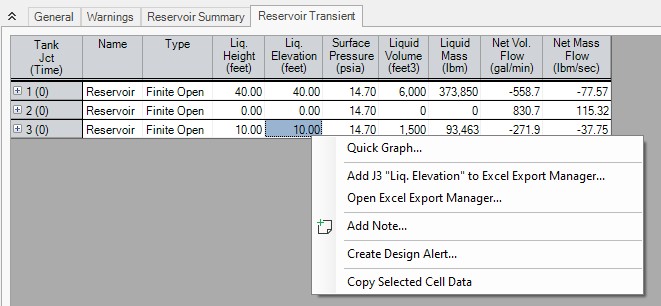
Figure 1: Quick Graph on the Output window is selected by clicking the with the right mouse button in a column of transient data
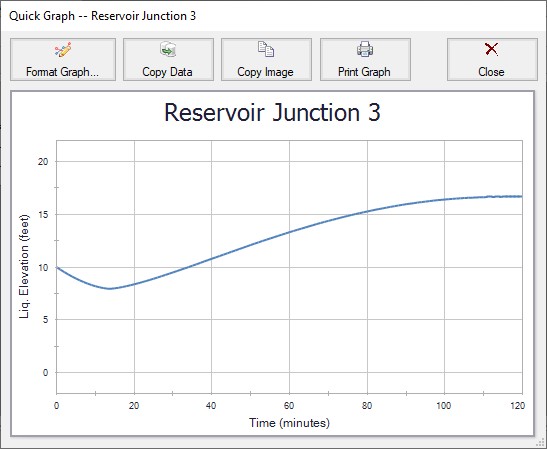
Figure 2: Quick Graph window is opened from Output window as shown in Figure 1
Related Topics
Related Examples


