XTS in Graph Results
(XTS Module Only) Transient data can graphed in the Graph Results window in two general ways: Profile graphs and transient graphs.
Pump vs. System curves can still be generated, but only when the Time Simulation is set to Steady Only. See the bottom of this topic.
Profile Graphs
Profile graphs show results where the distance along the pipe is the independent, x parameter (Figure 1). If the pipes are connected, a sequence of pipes can be graphed in the profile. Profile graphs can only show data at a particular time or show overall maximum and minimum values for all times (Figure 2).
Profile graphs can be created for one or more pipe sequences. Note that the x-axis on profile plots is cumulative distance along the pipe sequence.
Multiple profiles can be plotted simultaneously using the Groups on the Edit menu.
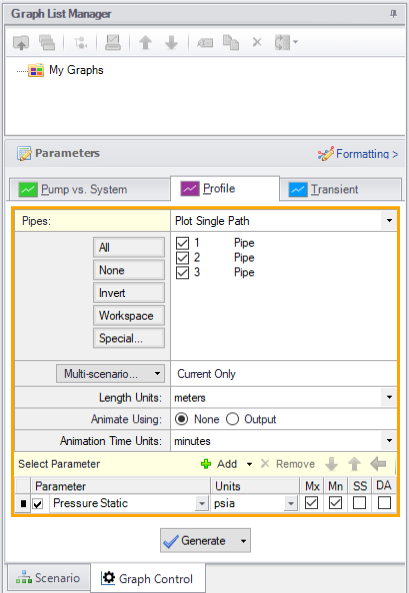
Figure 1: The Graphing panel showing a profile plot for a pipe sequence for maximum and minimum static pressure is to be generated
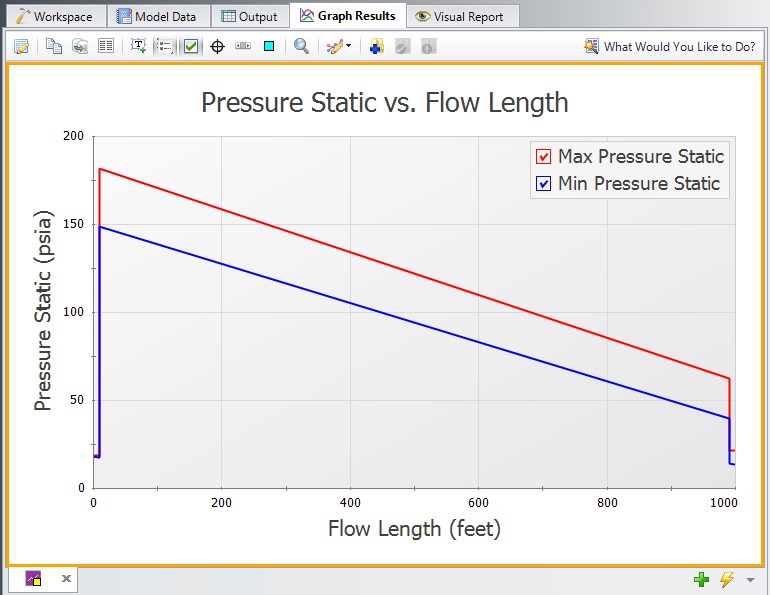
Figure 2: Transient max/min profile plot for pressure as specified in Figure 1
Animation of Output
Another useful feature of profile graphs is that they allow animation of the output results. Animation is selected in the Quick Access Panel (Figure 1) and, when selected, reveals additional control features on the Graph Results window. See Animating Transient Results for more information.
Transient Graphs
Transient graphs show how parameters vary with time (see Figures 3 and 4). Here the x-axis is time (rather than distance as in profile graphs) as shown in Figure 2.
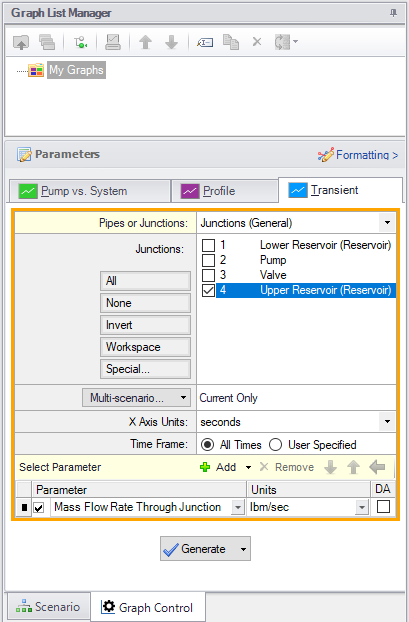
Figure 3: Setting up a Transient graph
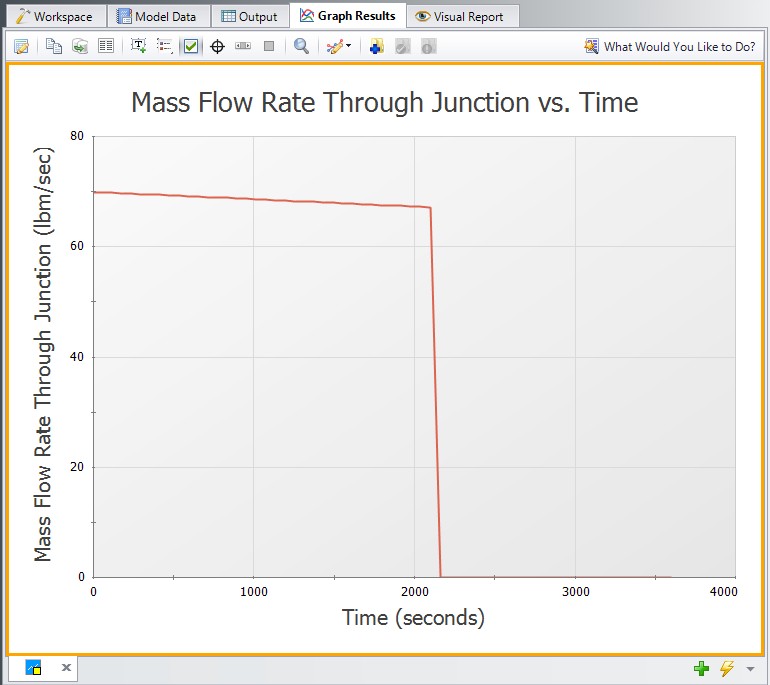
Figure 4: Transient graphs show how parameters vary with time
Pump vs. System Curves
Pump vs. System Curve plots can only be created for a steady analysis. To perform a steady analysis change the Time Simulation to "Steady Only" from the Analysis menu.
To create a pump vs. system curve for a time step other than the initial time step, create a child scenario, change the Time Simulation to "Steady Only," and adjust the model file inputs to reflect the time step you want to create a pump vs. system curve for.


