Estimating M From Recorded Data
(SSL Module Only) There is an option on the Solids Definition panel of the Analysis Setup window and Solids Library to estimate M from recorded data. Choose the button for M Curve Fit. This is based on discussion in Wilson, et al, 2006Wilson, K.C., G.R. Addie, A. Sellgren and R. Clift, Slurry Transport Using Centrifugal Pumps, 3rd Ed., published by Springer, 2006., on pages 128-136.
Figure 1 shows the M Parameter Curve Fit window. Data for velocity and relative excess pressure gradient are entered and a linear curve fit is generated on a log-log plot. The M factor is displayed at the top. Data that does not fit the curve can be disregarded by the user by deselecting the checkbox in the table.
M values are not allowed to be greater than 1.7 or less than 0.25 based on recommendations in Wilson, et al.
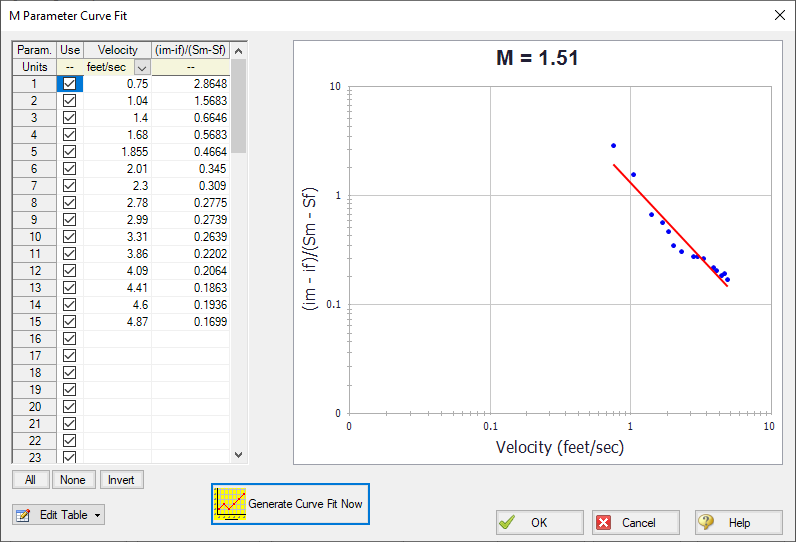
Figure 1: M curve fit window based on recorded data
Related Topics
Related Examples


