SSL in Graph Results
(SSL Module Only) Slurry system curves are common way of interpreting slurry behavior. Such system curves can be specified in the Graph Control tab of the Quick Access Panel.
When the SSL module is in use a new tab appears on the right called Slurry System Curve (Figure 1). Here, one can select the type of curve to generate.
Note: All pipes must be of the same diameter to use the Slurry System Curve.
Options to include pump curves (if a pump curve is used) and water curve cross plots are available.
The system curve is displayed in the Graph Results window (Figure 2).
Equations for Slurry System Curve
Fathom uses the equations below as are given in Wilson, et al, 2006Wilson, K.C., G.R. Addie, A. Sellgren and R. Clift, Slurry Transport Using Centrifugal Pumps, 3rd Ed., published by Springer, 2006. on page 320 to calculate the velocity (V) and head gradient (j) for the slurry system curve.


where V50 is the value of Vm at which 50% of solid are suspended in fluid, Vm is the mean velocity of the mixture, and fw is the friction factor of water.
Since the head gradient depends on the velocity, all pipes must be the same diameter to produce a meaningful curve.
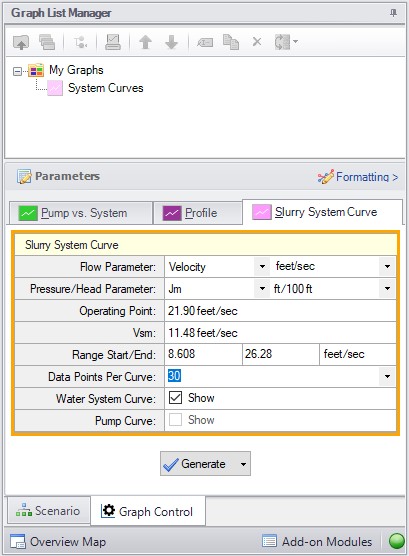
Figure 1: Slurry System Curve tab in the Quick Access Panel allows system curves to be created
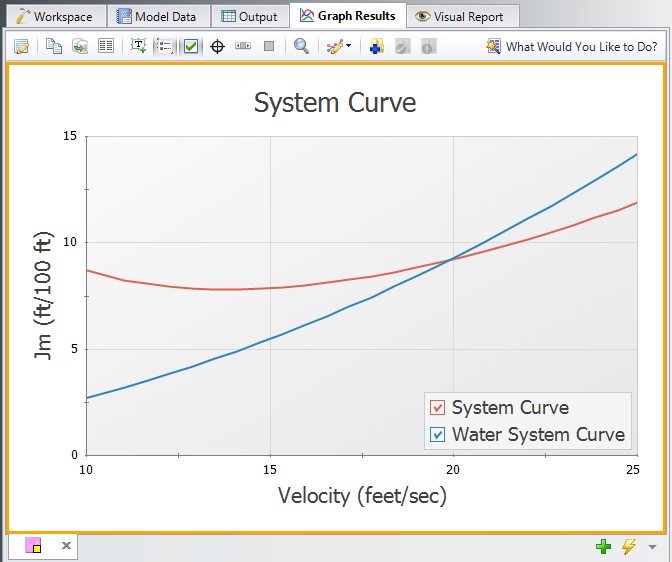
Figure 2: Graph Results window shows slurry system curve when using the SSL module


