Using Rheological Data
For the Power Law, Bingham Plastic and Herschel-Bulkley viscosity models, users are expected to define constants for each model. If the user already has these constants, they can be entered directly into the software. If the user only has the original rheological data, Fathom can calculate the viscosity model constants from that data.
The interface used to enter this data and the processes Fathom employs to manipulate it are similar for all of the viscosity models mentioned above. This page discusses rheological data only in the context of the Power Law model for simplicity. Unless specified otherwise, the content discussed here is applicable to all models.
Calculate from Rheological Data Interface
The Calculate from Rheological Data option can be accessed from the Viscosity Model panel in Analysis Setup. Click the Calculate from Rheological Data radio button and click the Calculate Constants button as shown below in Figure 1.
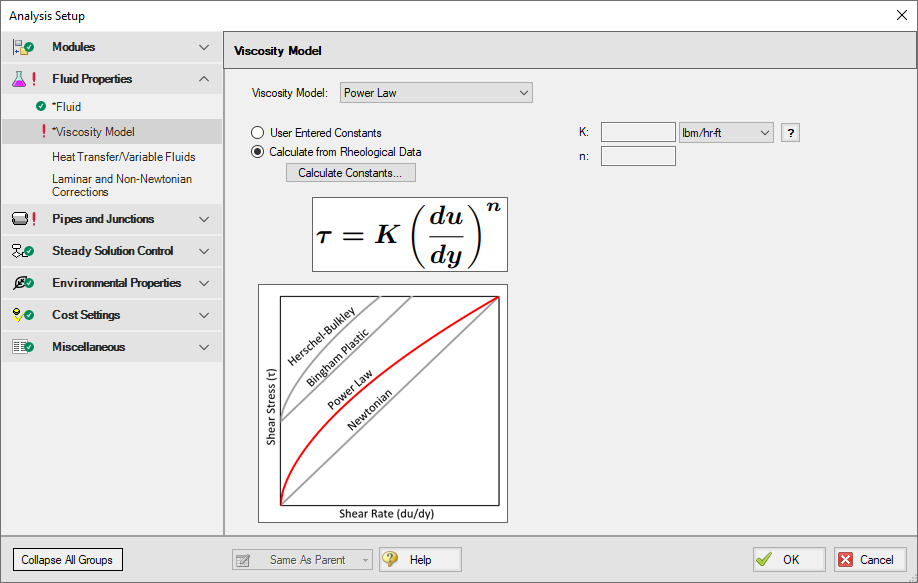
Figure 1: Power Law viscosity model using the Calculate from Rheological Data option
The Calculate Power Law Constants window will open to enter rheological data. This window is shown below in Figure 2. In this window, users are asked to enter Shear Stress (τ) vs. Shear Rate data in units of pressure and inverse time, respectively.
Two Raw Data Type options are presented above the table, Tube Flow Rheometer Data (8V/D) and Shear Rheometer Data (du/dy). These options refer to the experimental setup used to obtain the shear stress vs shear rate data entered in the table. Fathom version 11 and earlier assumed all entered data was the Tube Flow Rheometer Data (8V/D) type. Refer to the Types of Rheological Data section below for more information on which option to use.
Note: For Herschel-Bulkley fluids only the Shear Rheometer Data option is available at this time. This is because the method employed in Fathom to convert from Tube Flow Rheometer Data to Shear Rheometer Data has unknown accuracy for use with the Herschel-Bulkley model.
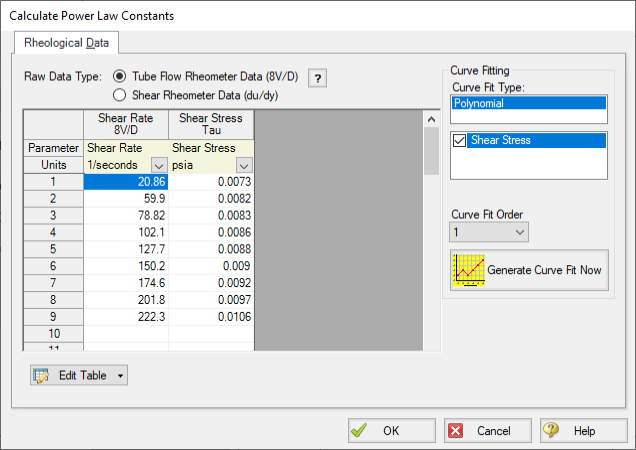
Figure 2: Rheological data input form
The user can click Generate Curve Fit Now to curve fit the data and obtain the viscosity model constants. Generating the curve fit will show the user a plot of their data along with the fitted constants, as shown below. Clicking OK will transfer those constants to the Viscosity Model panel and display the resultant Shear Stress vs Shear Rate curve fit graph.
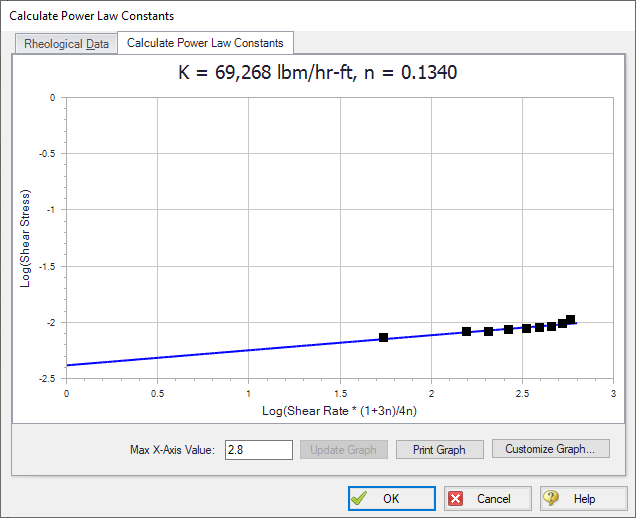
Figure 3: Curve fit rheological data and constants
Two major types of rheological test data exist. Many names and potential test devices exist for each type. For the purposes of this discussion, we must pick a single name for each type. One experimental setup is a tube flow rheometer while the other is a rotational rheometer.
Tube Flow Rheometer
A tube flow rheometer system consists of a pipe of some diameter and length connected to a high pressure source and a low pressure source. Varying the high pressure source drives flow through the pipe at different velocities. This experimental setup allows the engineer to obtain data on the pressure gradient (pressure drop per length) along the pipe for a given velocity. The engineer could also obtain this type of rheological data by directly measuring pressure and velocity along a pipe in an existing facility.
This data is then manipulated into shear stress and shear rate data, respectively. Specifically, the tube flow rheometer gives shear rate data where the shear rate is the bulk shear rate of the fluid. The measured velocity is the bulk velocity of the fluid, meaning only bulk shear rate can be calculated. Bulk shear rate can be calculated from bulk velocity using the equation 8V/D.
This type of rheological data may be more common in industries considering slurry applications or when the process facility is already in operation and data is obtained via direct measurements of the system operations.
Rotational Rheometer
A rotational rheometer system consists of a rotating device in contact with the fluid being studied. Common examples of this system include the cup and bob (couette) rheometer and the cone and plate rheometer. Varying the angular rate of the rotating device creates different shear rates in the fluid. This experimental setup allows the engineer to obtain data on the torque required to achieve a given angular rate of rotation.
This data is then manipulated into shear stress and shear rate data, respectively. Specifically, the rotational rheometer gives shear rate data where the shear rate is the wall shear rate of the fluid. The angular rate of rotation and equipment geometry are directly known, and thus the shear rate is calculated at the wall of the rotating device.
This type of rheological data is more common when data is obtained via small-scale, laboratory tests. If rheological data is presented with information about rate of rotation (RPM, revolutions per second, Hx, etc.), the data was likely obtained from a rotational rheometer.
Finally, modern rotational rheometers will commonly manipulate the directly measured torque and angular rate of rotation data for the engineer, returning the raw data along with shear stress or viscosity vs. shear rate data. Note that Fathom requires the user to define shear stress vs. shear rate data when entering rheological test data. If the user only has viscosity vs. shear rate data, they should curve fit the constants for the desired viscosity model manually.
Converting Between Types of Rheological Data
Although two types of rheological data exist, most viscosity models expect rotational rheometer data. Fathom employs the Rabinowitsch-Mooney technique to convert from tube flow rheometer data to rotational rheometer data when necessary.
The Rabinowitsch-Mooney technique can be applied to obtain rotational rheometer data from tube flow rheometer data as follows:
-
Plot the tube flow rheometer data on a log-log scale.
-
Determine the slope of the data. The slope is represented by n’.
-
Multiply the tube flow rheometer data by the value:

Fathom now has rheological data in the form of rotational rheometer (rheogram) data, which can be used to directly fit the viscosity model constants.
Related Blogs
Non-Newtonian Fluids - How to Model the Soap, Silly-Putty, or Shampoo in Your Pipe Network


