Pulse Setup Panel
The Pulse Setup panel (Figure 1) allows you to specify required input for the PFA module, including the junction at which the pulse will be applied, as well as the pulse properties. This panel will not be visible unless the PFA module has been activated from the Modules panel.
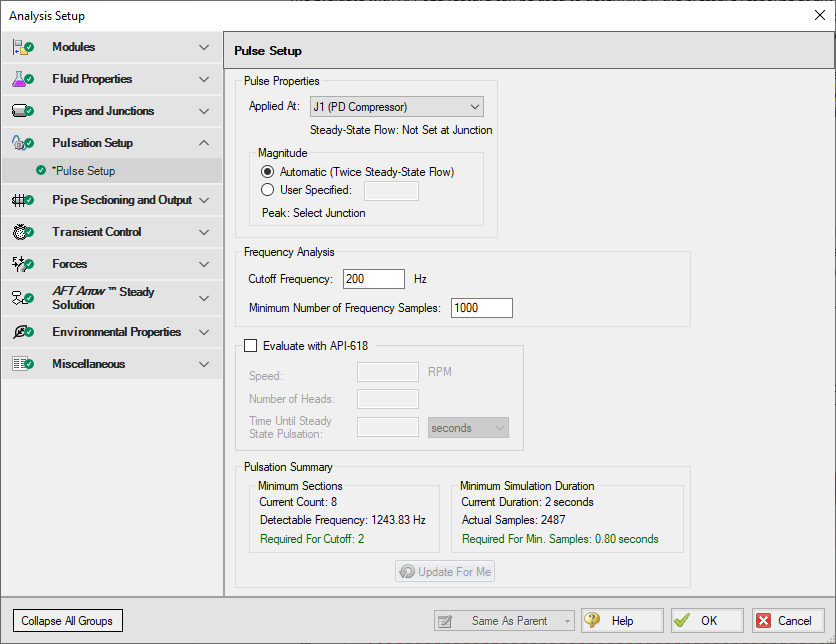
Figure 1: Pulse Setup panel in the Analysis Setup window
Pulse Properties
At the top of the window the Pulse Properties can be specified, including the junction that will act as the source of the pulse and the magnitude of the pulse. By default, the magnitude of the pulse is twice the steady-state flow, but you have the option to define this magnitude as “User Specified”. This pulse will be assumed to last for two time steps and then return to steady-state flow. The pulse can only be applied to an assigned flow junction.
The cutoff frequency in xStream is the maximum frequency for displayed output. The defined cutoff frequency must be less than or equal to the detectable frequency for the analysis, which is calculated using the equation for maximum frequency as follows

where dt is the time step. The time step for the model is not known until run-time; However, the time step can be estimated based on the inputs on the Pipe Sectioning panel. The Pulsation Summary at the bottom of the Pulse Setup panel shows the Detectable Frequency based on the current settings on the Pipe Sectioning panel, as well as the minimum number of sections required to capture the specified cutoff frequency. If the current Cutoff Frequency and sectioning are not valid for the analysis, then either the Cutoff Frequency should be decreased, or the minimum number of sections should be increased.
When the Analysis is run it is possible to account for all frequencies up to the Detectable Frequency calculated based on the time step. However, the results in the output will only display frequencies up to the user defined Cutoff Frequency. Therefore it is important to define a large enough Cutoff Frequency to be able to analyze all relevant frequency responses.
Minimum Number of Frequency Samples
The minimum number of frequency samples used to generate the forcing function is specified in the Frequency Analysis section of the Pulse Setup panel. The default of 1000 should be sufficient for most cases. The Minimum Number of Frequency Samples will impact the required simulation duration - a larger number of samples will require a longer simulation duration. The required simulation duration can be calculated by dividing the minimum number of frequency samples by the detectable frequency. If the current simulation duration is not long enough to accommodate the minimum number of frequency samples, then the simulation duration should be lengthened on the Simulation Mode/Duration panel, or the minimum number of frequency samples should be decreased.
Evaluate with API-618
The Evaluate with API-618 feature can be used to determine if the pressure response at any of the acoustic natural frequencies of the system exceeds the limits defined in API-618 for reciprocating compressors. To evaluate API-618 the model should be first be run with PFA enabled and the API-618 feature disabled to determine the acoustic frequencies. Once the excitation frequencies are known, child scenarios can be created by the user to evaluate the pressure results when the compressor operates at the excitation frequencies, as is demonstrated in the last step of the Frequency Analysis Example. The API-618 evaluation should be enabled in the excitation frequency child scenarios to check if the pressure results exceed the limits in API-618.
The required inputs to check API-618 are as follows:
-
Speed - The speed the reciprocating compressor is operating at.
-
Number of Heads - The number of pistons in the reciprocating compressor.
-
Time Until Steady State Pulsation - The time required for the dissipation of artificial transients caused by the introduction of a flow rate wave to the system. This time should be determined by running the scenario with the "Time Until Steady State Pulsation" set to 0, then plotting the pressure results at the outlet of the compressor. The Time Until Steady State Pulsation should be set as the time at which the pressure waves have consistent amplitudes. For example, in Figure 2 below the waves begin to reach constant amplitude at about 0.25 seconds. It is best to choose a slightly longer time interval than the estimated time interval for increased accuracy when checking API-618.
Note the Time Until Steady State Pulsation input only changes which pressure results are included in the API-618 evaluation, the transient results are not impacted by this time.
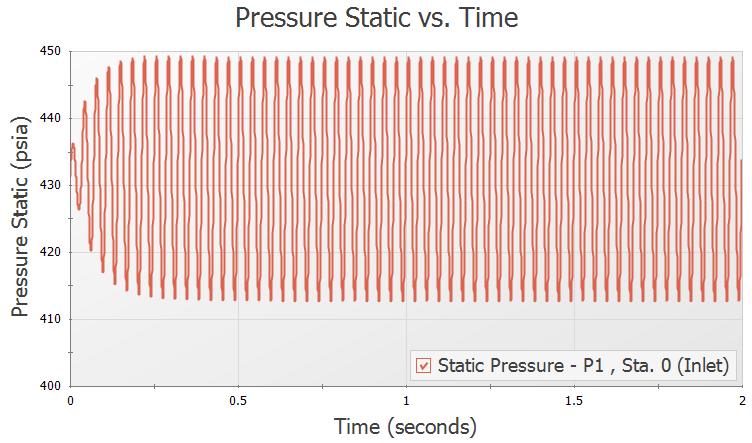
Figure 2: Example pressure results at the outlet of the reciprocating compressor with an oscillating flow transient specified.
The equations for the API 618 peak to peak pressure level limits are as follows (American Petroleum Institute 1995American Petroleum Institute, API STD 618: Reciprocating Compressors for Petroleum, Chemical, and Gas Industry Services, 4th Edition, American Petroleum Institute, Washington, DC, US, 1995., pg 40):


where P1(%) is the maximum allowable peak to peak pressure level of individual pulsation components at fundamental and harmonic frequencies, as a percentage of absolute line pressure, PL is the average absolute line pressure in psi (bar for SI), ID is the inside diameter of the pipe in inches (mm), andf is the pulsation frequency in hertz.
Pulsation Summary
The Pulsation Summary section at the bottom of the Pulse Setup panel provides information on the current transient settings in the model to check that the sectioning and simulation duration are sufficient based on the user-specified Cutoff Frequency and Minimum Number of Frequency Samples. Therefore the Pulsation Summary will only be able to display results if the Pipe Sectioning panel and Simulation Mode/Duration panel have already been fully defined.
The Update For Me button under the Pulsation Summary can be used to update the Minimum Number of Sections and/or the Stop Time for the simulation if they are not sufficient based on the user-specified Cutoff Frequency and Minimum Number of Frequency Samples.
A short description of each of the Pulsation Summary items is given here.
-
Minimum Sections
-
Current Count - Displays the "Minimum Number of Sections Per Pipe" defined on the Pipe Sectioning panel
-
Detectable Frequency - Displays the Max Frequency calculated as discussed above in the Cutoff Frequency section
-
Required for Cutoff - Displays the required Minimum Number of Sections Per Pipe which allow the Detectable Frequency to be greater than or equal to the Cutoff Frequency
-
-
Minimum Simulation Duration
-
Current Duration - Displays the current simulation duration defined on the Simulation Mode/Duration panel (Stop Time minus Start Time)
-
Actual Samples - Displays the Actual Samples used for the frequency analysis, calculated by multiplying the Current Duration by the Detectable Frequency
-
Required For Min. Samples - Displays the minimum required simulation duration based on the user-specified Minimum Number of Frequency Samples and the calculated Detectable Frequency
-