Output Window
The Output window is the primary vehicle for communicating the results of an analysis in text form (see Figure 1). The Output window follows the same general window organization as the Model Data window.
When a model is submitted to the Solver (the part of AFT Fathom that applies the governing incompressible flow equations to obtain a solution to the pipe system), the Solution Progress window appears. After the solution is obtained, you can view the results in the Output window by clicking the View Output button.
If the information in the Output window is not in the desired format, you can choose Output Control from the Tools menu (or Toolbar) to modify the format. Output Control lets you specify the parameters, their units, and the order of their display in the Output window.
The Output Print Content window available on the Tools menu (or Toolbar) lets you specify the content to include in the printed Output report and select the font to be used.
The Sort window opened from the Arrange menu (or Toolbar) offers the ability to sort the Pipe Results or Junction Results tables according to the values in any of the columns.
The Transfer Results to Initial Guesses feature on the Edit menu (and Toolbar) sets all pipe and junction initial flows and pressures equal to the converged results, which causes future runs to converge much faster.
You can view the input data for individual pipes or junctions directly from the Output window. To do this double-click the pipe or junction row, which will open the properties window in read-only form where you can review input in detail.
General, Pipe, and Junction section display sizes can be changed by the user by clicking and dragging the bars between each section to resize them. Each section can also be hidden by clicking the arrow in the upper left of each section.
You can use the zoom feature in the lower right hand corner of the Output window to resize the text displayed on screen.
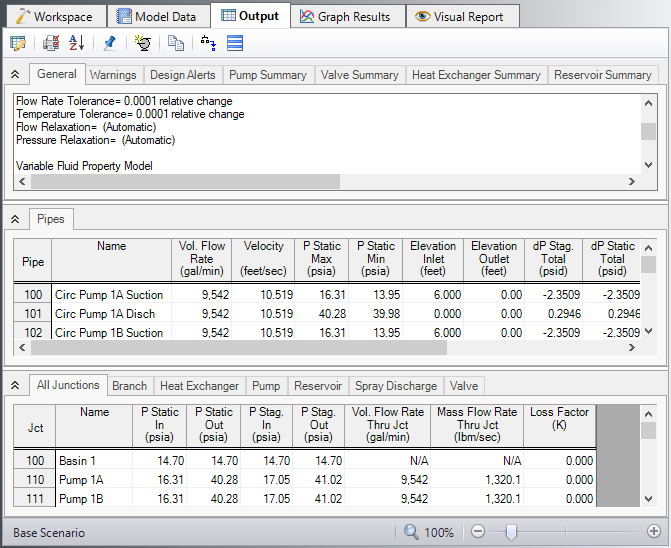
Figure 1: The Output Window
Right-click Context Menu Actions
There are several options available when right-clicking on a cell, row header, column header, or entire table in the Output window:
-
Column Header
-
Change Units - Quickly redisplay the selected column in a different unit.
-
Sort - Sort the table in Ascending or Descending order on the selected column.
-
Add "Parameter" for all Table Objects to Excel Export Manager - Add this column to the Excel Export Manager.
-
Open Excel Export Manager - Directly open the Excel Export Manager.
-
Copy Selected Cell Data - Copies all of the values in the column to the clipboard.
-
Row Header
-
Add all Object Parameters to Excel Export Manager - Add this row to the Excel Export Manager.
-
Open Excel Export Manager - Directly open the Excel Export Manager.
-
Find on Workspace -Quickly locate an object on the Workspace.
-
Copy Selected Cell Data - Copies all of the values in the row to the clipboard.
-
Open Properties Window - Opens the properties window for the associated pipe or junction.
-
Table (upper left cell)
-
Add Object Table to Excel Export Manager - Add the entire table to the Excel Export Manager.
-
Open Excel Export Manager - Directly open the Excel Export Manager.
-
Copy Selected Cell Data - Copies all of the values in the table to the clipboard.
-
Cell
-
Add Object "Parameter" to Excel Export Manager - Add this cell to the Excel Export Manager.
-
Open Excel Export Manager - Directly open the Excel Export Manager.
-
Create Design Alert -Create a Design Alert related to the selected object and value.
-
Copy Selected Cell Data - Copies the value of the cell to the clipboard.
Whenever you change the input model, all output windows are erased. This prevents you from changing your input model, forgetting to rerun it, and mistaking the previous Output window for the current model's results.
Results diagrams are available for both pump results (see Figure 2) and pipe heat transfer results (see Figure 3). These diagrams allow you display the information in a more intuitive manner, copy the image of the diagram to your clipboard, or print the diagram. The option to show the results diagram can be found in the pump summary tab for pumps or the heat transfer tab for pipes with heat transfer.
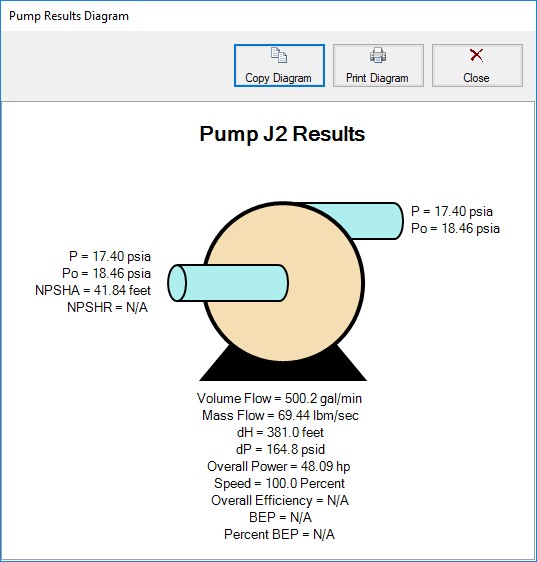
Figure 2: Pump Results Diagrams
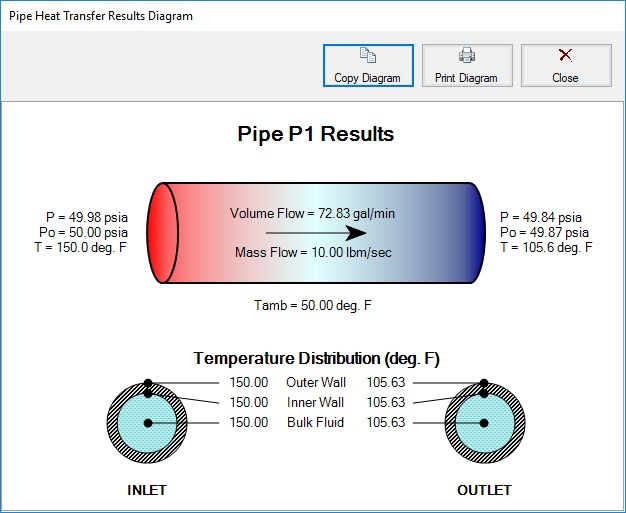
Figure 3: Pipe Heat Transfer Results Diagram
Data in the Output window can be:
-
Copied to the clipboard
-
Saved to a formatted text file
-
Exported to an Excel spreadsheet
-
Saved directly to an Adobe PDF file
-
Sent to the printer
The printed and Adobe PDF output follows the same format as the Output window itself.


