XTS in Output
(XTS Module Only) Transient simulations create more output data than steady-state runs. This data is displayed in the Output window in two general ways.
First, the pipe and junction output tables now reflect output at a specific point in time. In Figure 1 below the displayed results are 10 minutes into the simulation. This can be seen at the bottom left of Figure 1. The forward/reverse buttons and the slider at the bottom allow changing the currently displayed time.
Second, the results for all time steps are displayed together in the tables labeled "Transient". Figure 2 shows the same output as Figure 1, except the transient reservoir, pipe and pipetabs have been selected for display. Here one sees multiple results for each pipe or junction. For example, look at the transient pipe data in the middle tables. While the table holds data for all pipes, one can see here only part of the data (up to 3 minutes) for the first pipe, pipe 1. In the far left column, the first data is the pipe number (#1) and the adjacent number in parentheses is the time for that row (in the units defined for the time step interval, - minutes in this case). The time unit of seconds is displayed in the bottom left, and can be changed in the Output Control time formatting. The data in Figure 2 shows these changes over each time step. The transient tables are organized with a collapsing/expanding capability for each pipe or junction to facilitate data viewing.
Notice that each of the junction Summary reports at the top of Figure 1 (in the General Section, see Pump, Valve and Reservoir Summary) have a parallel Transient table that goes with it.
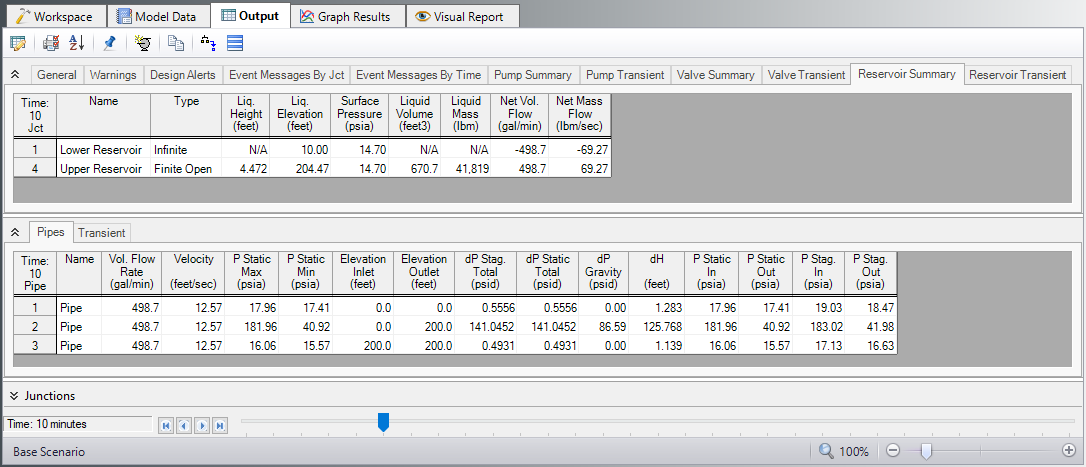
Figure 1: Output window displaying data at 10 minutes
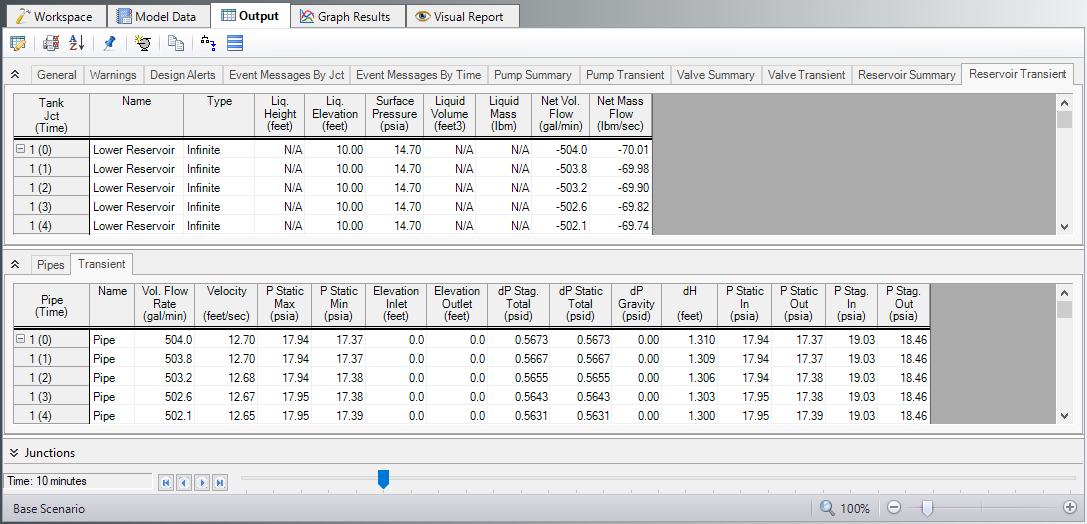
Figure 2: Output window displaying transient data for entire simulation
Related Examples
Beginner: Filling a Tank - XTS
Controlled Heat Exchanger Temperature - XTS
Related Topics


