XTS in Visual Report
(XTS Module Only) The Visual Report data will be displayed at a selected time. The slider bar and buttons at the bottom of the Visual Report work the same as the Output window time selection controls. When the user changes the current time, the displayed values change as well. In addition, color maps are updated when in use.
As shown in Figure 1, the current time is displayed in the lower left by the time adjustment buttons. The time can also optionally be displayed next to the model as well. The display on the Visual Report can be turned on and off on the Visual Report Control window. It is helpful to have the time on the Visual Report when it is printed.
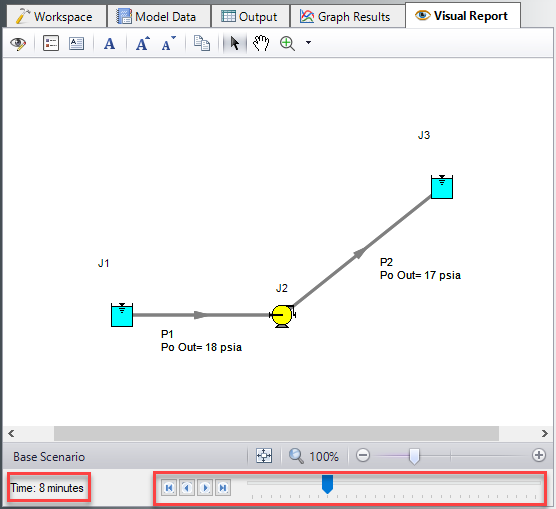
Figure 1: Visual Report has additional time adjustment controls when in AFT Fathom is in Transient mode


