Four Quadrant Data Sets
Four Quadrant data for a specific pump is rarely available. Manufacturers generally will only test pumps in the Normal Pumping Zone - positive flow, speed, head, and torque. Testing a pump outside of this range is expensive, and often requires testing apparatus beyond what is required for the standard range.
Even though four quadrant data specifically related to a certain pump may not be available, it is still important to account for the effects of reverse flow and speed when they occur. Making an estimation with a Standard Pump Curve is not sufficient in most cases, so another approach must be taken.
This approach - also an estimation - is to utilize four quadrant data from a similar pump. It is not unreasonable to assume that two pumps of similar construction would behave similarly under any given flow condition. It may be that the specific pump of interest may have only been tested in the Normal Pumping Zone, whereas the very similar pump may have been tested in all four quadrants. The test data may be used as a basis for the simulation of the pump of interest, with some adjustments.
What Makes a Similar Pump?
Accepting that data from a similar pump can be used for the simulation, we can proceed with selecting some data from an appropriate pump with all of the required data. However, how do we know what data is appropriate? It is highly unlikely that a physical comparison between the two pumps can be made. It is even unlikely that the rated parameters for the similar pump will be available, as the data is almost always stored in a dimensionless form as described in Four Quadrant Model Overview.
Fortunately, there is one convenient parameter that is traditionally used to characterize pumps of similar operation - specific speed. Specific speed attempts to describe the overall characteristics of a pump by relating its discharge and head. Pumps of an identical specific speed can generally be assumed to behave the same, even if they are of different design or size.
This means that if a set of four quadrant data has a specific speed similar to the pump being analyzed, this data can be applied without needing to know anything further about the pump that was actually tested.
Potential Issues Using Specific Speed to Measure Similarity
Turbomachines are complex devices with many components that affect their behavior. Breaking down this behavior into a single number - specific speed - necessarily has some drawbacks. Two pumps of identical specific speed may not show exactly the same behavior at all flows and speeds. Some references (Brown and Rogers, 1980 Brown R.J. , and D.C. Rogers, Development of Pump Characteristics from Field Tests, Journal of Mechanical Design, ASME, vol. 102, pp. 807-817, Oct., 1980. ) indicate that the correlation between overall behavior and specific speed is less than may be expected, especially for low specific speed (radial) devices.
It could be the case that a four quadrant data set developed for a pump of a different specific speed may be more appropriate in a given simulation, as it may better reflect the behavior of the pump in question.
Using Existing Data is an Estimation
When applying existing data to simulation, it is critical to remember that this method is an estimation. For accurate results, test data from the actual pump should be used. Experience shows that this estimation, when properly applied, is acceptable within the normal bounds of fluid transient analysis. The accuracy of the estimation depends heavily on the specific pump, the data set used, the system, and how the estimation is applied.
Furthermore, because the four quadrant data sets are stored in a dimensionless form, to be used in simulation they must be made dimensional. The dimensional data can be forced to match in certain conditions, which will force the data not to match in other conditions. Because the data sources represent two different pumps, a perfect match under all conditions is impossible.
The data is made dimensional with a given reference point based on the Standard Pump Curve. This choice can have dramatic impacts on the simulation, as described in Four Quadrant Dimensional Reference Point.
Four Quadrant Data Sets Available in AFT Impulse
There are many four quadrant data sets available for use in AFT Impulse, from a variety of sources. Many of these data sets appear in multiple references throughout the technical literature on four quadrant methods. The available data sets are listed in Table 1 below.
Notice that each data set is labeled as Preferred, Average, or Use With Caution. By default only preferred and average data sets will be shown. These recommendations are based on Walters, Dahl, and Rogers, 2020 Walters, T., Dahl, T. and Rogers, D.C., "Pump Specific Speed and Four Quadrant Data in Waterhammer Simulation - Taking Another Look", Proceedings of the ASME 2020 Pressure Vessels and Piping Conference, PVP 2020, Minneapolis, MN, USA, July 19-24 2020. which uses a comparison of the four quadrant data sets to the stepanoff curves to evaluate the quality of the test data and the accuracy of the reported specific speed for each data set. Figure 1 which was adapted from Walters, Dahl & Rogers (2020) shows several of the four quadrant data sets used in Impulse compared to the stepanoff curves. The 13500(262) and 1800(34.9) curves, shown in red and blue on the figures, are listed as preferred in Impulse, while the 7600(147) curve, shown in yellow, is listed as average.
Table 1: Four Quadrant Data Sets Available
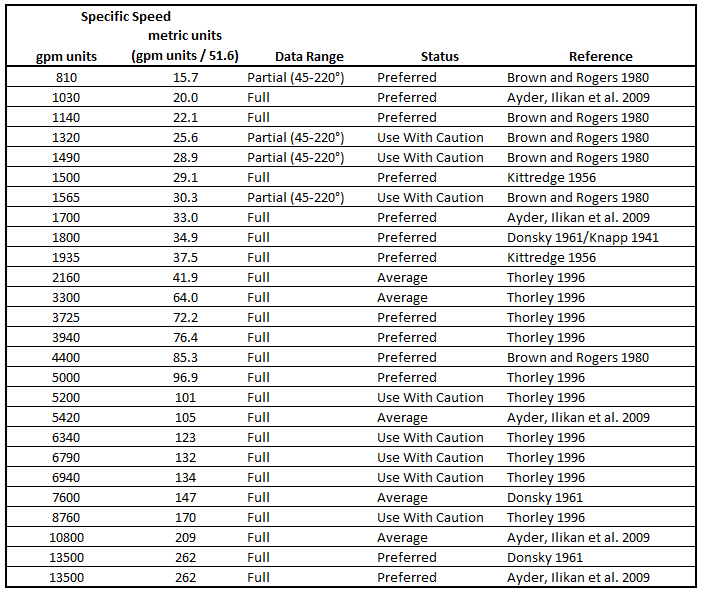
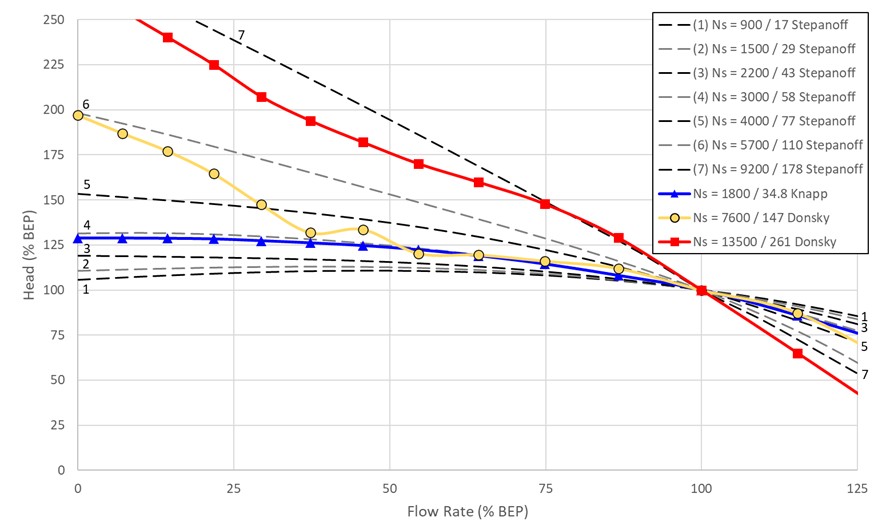
Figure 1: Comparison of head curves from several four quadrant data sets to Stepanoff curves
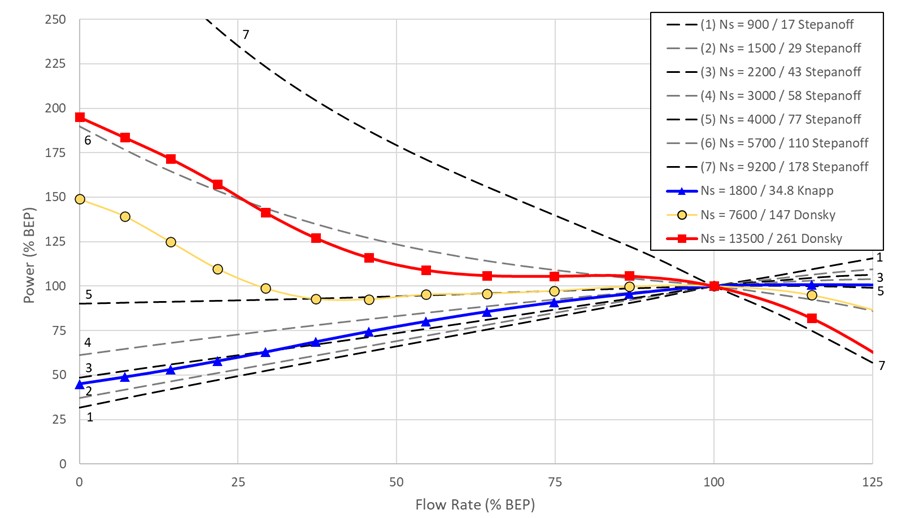
Figure 2: Comparison of power curves from several four quadrant data sets to Stepanoff curves


