Compressor/Fan Configuration
The compressor/fan configuration window is used to define the specific operation of a centrifugal compressor or fan modeled with a curve. It is opened by selecting the Enter Curve Data button from the Compressor/Fan Properties window when a centrifugal compressor or fan is specified.
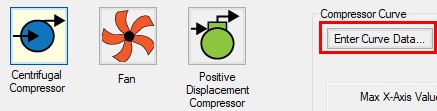
Figure 1: Enter Curve Data
Configuration Method
By default, a compressor/fan curve is defined using the Simple configuration. This means that the user inputs only one compressor/fan curve for the junction.
If the Configuration Method is changed to Multiple, additional input becomes available on the right of the configuration window. This allows defining different curves to represent the behavior of the compressor/fan at different speeds or impeller diameters. See a detailed description in Compressor/Fan Multiple Configuration. This feature is especially useful when multiple curves for a given compressor/fan junction must be evaluated as it prevents the user from having to delete and enter curve data.
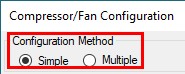
Figure 2: Compressor/Fan Configuration Method
Compressor/Fan Data
The first tab of the compressor/fan configuration controls the turbomachine's most basic behavior - the compressor/fan curves.
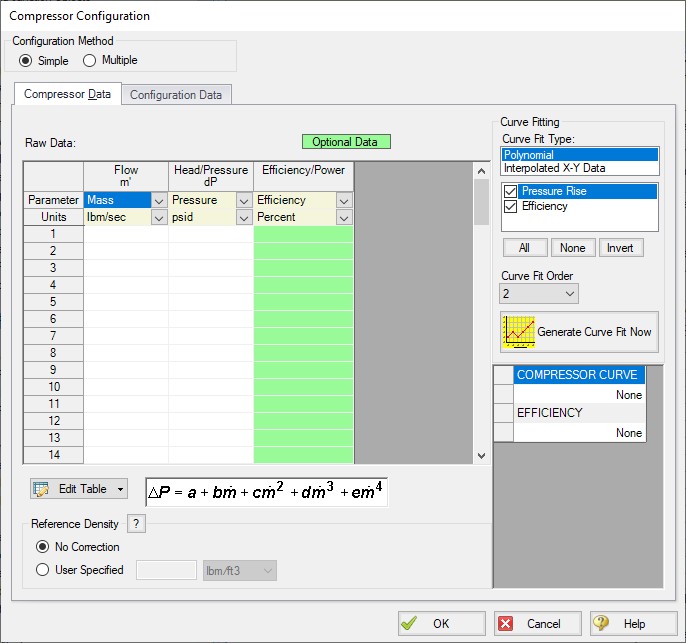
Figure 3: Compressor/Fan Data
A compressor/fan can have two types of curves defined:
-
Flow vs. Head/Pressure/Compression Ratio - Required. This is what is commonly referred to as the "compressor/fan curve" and defines how much pressure the turbomachine can add to a fluid at any given flowrate.
-
Flow vs. Efficiency/Power - Optional. Data entered in this column allows for quick assessment of power used at the operating point and the proximity to Best Efficiency Point (BEP). This data can also be used to determine the compression heating effects for a centrifugal compressor.
After entering the raw values into the table, the data needs to be curve fit.
If Mass Flow, Pressure, or Power are used in the curve definitions, Reference Density becomes an additional required input.
If the Compression ratio is used for the curve definition, the Reference Inlet Conditions are an additional required input.
Configuration Data
This tab controls some additional behavior or input for a compressor/fan junction modeled with a curve. Entering or changing values on this tab is optional.
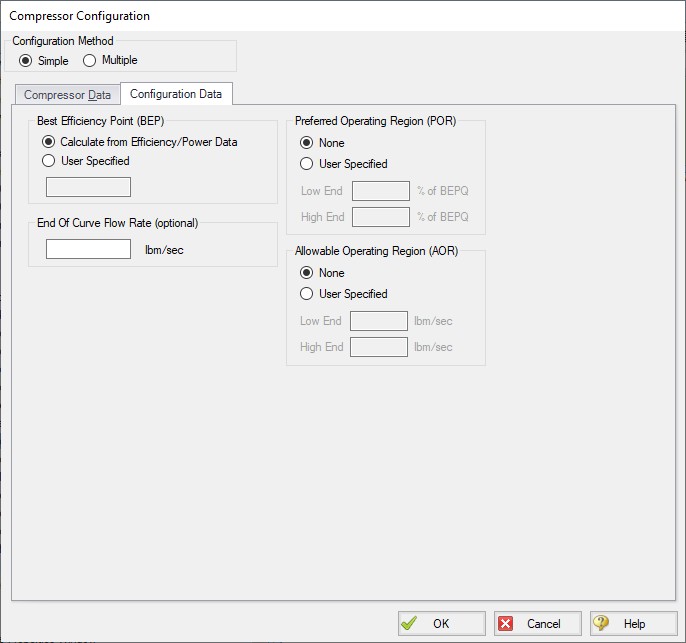
Figure 4: Configuration Data for Compressor
-
Best Efficiency Point (BEP) - The Best Efficiency Point (BEP) by default is calculated from the entered efficiency or power curve. This is generally the preferred option as it best relates to the true meaning of BEP. A User Specified value can be entered if no efficiency or power curve is available, or if it is desired to force the BEP to a certain flow.
-
End Of Curve Flow Rate (optional) - This value is used to create a warning in the output if it is exceeded. It does not affect the solution - the model will behave identically regardless of how this value is defined.
-
Preferred Operating Region (POR - Compressor Only) - % of BEP values falling outside of the defined range will generate a warning in the model output. This range can be defined by the user.
-
Allowable Operating Region (AOR - Compressor Only) - Similarly, this flow range creates a warning in the output when the user specified flow range is not adhered to.
Graphs
The following tabs display the curves that have been fit to the given data. If multiple curves are defined, the Composite Graph tab becomes available. The other graph tabs show the individual curves, along with points representing the raw data. It is a good idea to check these graphs to confirm the curve fit is reasonable for any potential operating region.
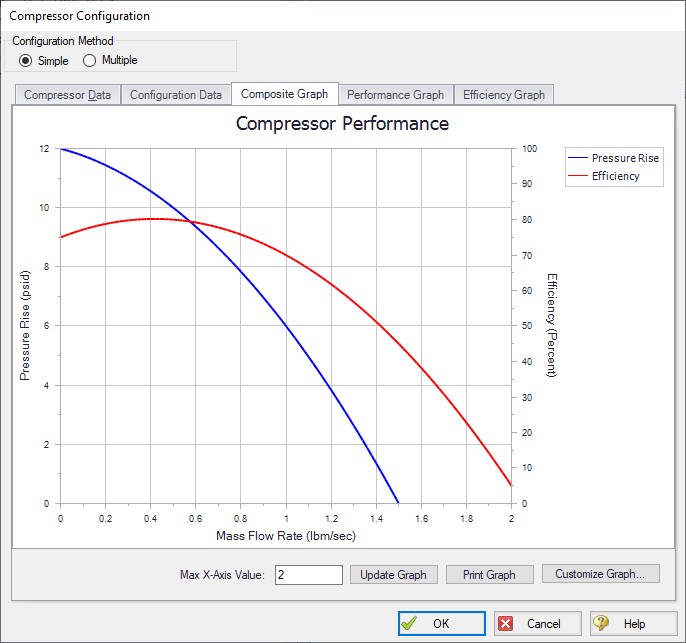
Figure 5: Composite Graph
Related Topics
Compressor/Fan Efficiency Data
Compression Ratio Reference Inlet Conditions
Positive Displacement Compressor
Poor Compressor/Fan Curve Fits
Related Examples
Related Blogs