Homogeneous Scale-up Method
The Homogeneous Scale-up method for non-Newtonian fluids is based on the idea that test data for velocity and pressure drop along pipes of a given diameter can be scaled up to model the velocity and pressure drop for a pipe of a large size.
This scale-up is similar to using the affinity laws to predict pump behavior. Instead of scaling pressure rise and volumetric flowrate for a pump, the Homogeneous Scale-up method scales the frictional gradient (jm) and mean velocity (Vm) for a pipe.
To employ this method, users must have test data from the same Tube Flow Rheometer as is available when entering rheological data for the Power law, Bingham Plastic, and Herschel-Bulkley models.
Homogeneous Scale-up Interface
The Viscosity Model panel appears as shown below in Figure 1 when the Homogeneous Scale-up method is selected. Click the Enter Scaled Data button to enter data.
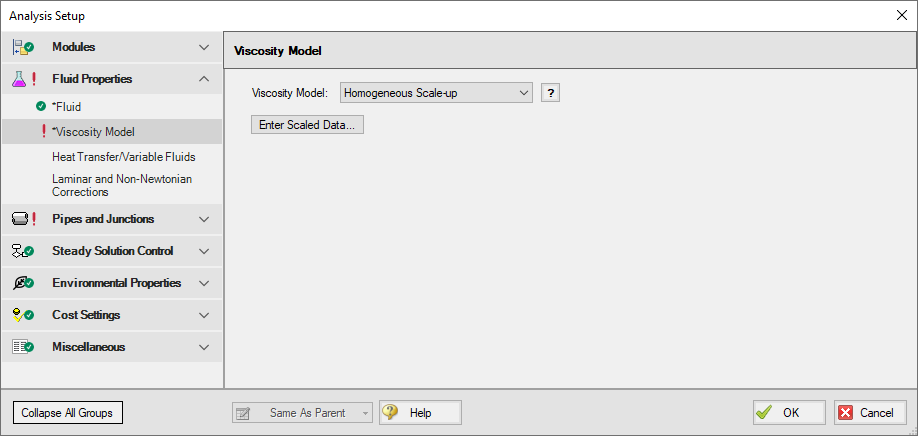
Figure 1: Viscosity Model panel for the Homogeneous Scale-up method
The Homogeneous Scale-up window is shown below in Figure 2. Here, the user must specify information about the pipe used to obtain the test data along with the test data itself. The flow data can be entered as mass flowrate, velocity, volumetric flowrate, or shear rate data as determined by a tube flow rheometer. The Head/Pressure data can be entered in terms of Head gradient, Pressure gradient, or shear stress data as determined by a tube flow rheometer.
Each data point must also be marked as laminar or turbulent flow.
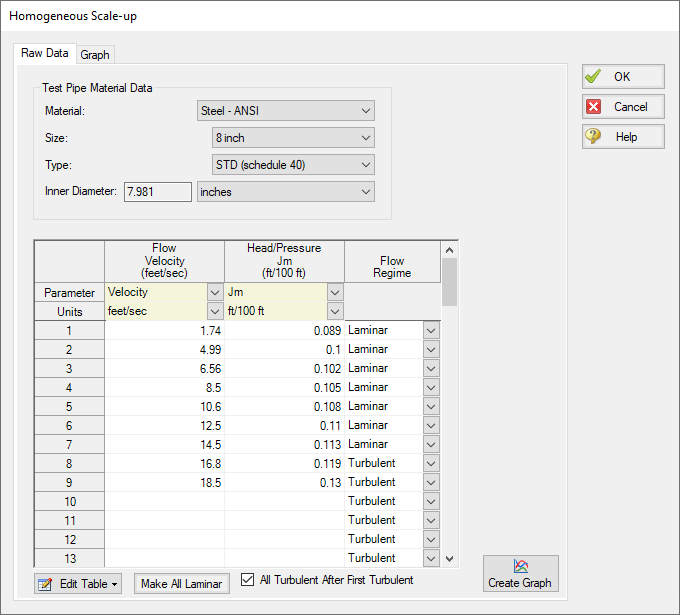
Figure 2: Homogeneous Scale-up Data entry window
The user can also generate a graph of their data plotted against other viscosity models and larger scaled pipe sizes. This interface is shown in Figure 3 below. Note that generating a cross-plot for the Power Law or Bingham Plastic models does not mean Fathom will use those models in the system. The cross-plot is intended only to give a visual comparison of the data.
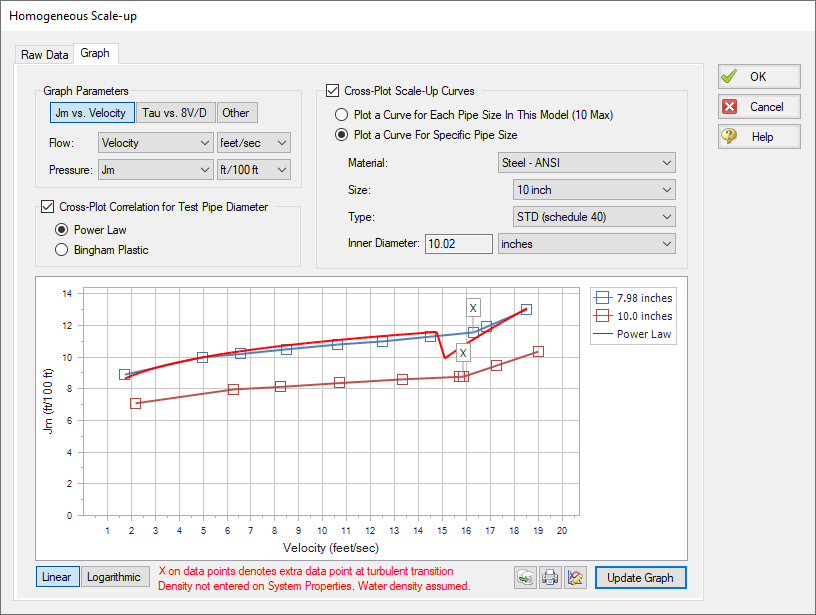
Figure 3: Graphed data for the Homogeneous Scale-up method
Theory and Correlations
The Homogeneous Scale-up methods are based on Chapter 3 of Wilson, et al, 2006Wilson, K.C., G.R. Addie, A. Sellgren and R. Clift, Slurry Transport Using Centrifugal Pumps, 3rd Ed., published by Springer, 2006., page 67.
Laminar data scales as follows:


Turbulent data scales as follows:


Where:
-
Data point 1 is the test data
-
Data point 2 is the larger system
-
τ is the shear stress at the pipe wall
The pressure drop calculated using these methods is then substituted into the network solution and iterated upon until a converged solution is available.
These correlations are valid across the full range of Reynolds number. The applicability of this method to highly turbulent flow is limited only by the test data the user has available.
Related Topics
Duffy Method (Pulp and Paper Stock)
Brecht & Heller Method (Pulp and Paper Stock)
Related Examples
Related Blogs
Non-Newtonian Fluids - How to Model the Soap, Silly-Putty, or Shampoo in Your Pipe Network


