Interpreting Cavitation Results
Transient Cavitation is one of the most complex physical phenomena which AFT Impulse tries to model. Impulse’s solution methodology assumes that all pipes are 100% liquid-full, yet cavitation inherently violates that assumption. As such, potentially significant uncertainty is inherent to results from any system which sees cavitation, and the user must carefully analyze their results to determine how reliable those results are.
Determining reliability is neither straightforward nor easy. The below discussion attempts to give guidance on how to best approach the problem, but finding an exact answer is almost impossible. As with any complex engineering task, the engineer must use good judgement to draw meaningful conclusions.
Percent Vapor Volume
A first indicator of how reliable results showing cavitation are, is how much vapor volume is predicted during cavitation relative to the size of the system. Impulse’s cavitation models are meant to capture limited amounts of transient cavitation, and as the vapor volume in the system increases, confidence in the results decreases.
Impulse reports on Percent Vapor Volume in the Transient Max/Min tables in the Output window. Percent Vapor Volume divides the vapor volume at each station by the pipe volume for each computation station, and is reported as a percentage.
A Warning message is shown when Percent Vapor Volume exceeds 10% at any station, and a Critical Warning is shown when Percent Vapor Volume exceeds 100% at any station.
These messages are meant to convey increasing uncertainty as Percent Vapor Volume increases. When vapor volume is small relative to the pipe volume, Impulse’s 100% liquid-full assumption is violated, but to a small degree, and more confidence can be placed in the results. As vapor volume increases, it grows past what either DVCM or DGCM is meant to capture, and confidence in the results decreases. When calculated vapor volume exceeds the physical pipe volume, reported results are unreliable, and the engineer must take great care when using them.
Numerical Noise
A second indicator of how reliable results showing cavitation are, is if mathematical noise is present in the cavitation results. Both cavitation models – DVCM and DGCM – perform complex, sensitive calculations which are sensitive to small changes in calculations.
There are many situations in which numerical noise can be present in the results. DVCM in particular can encounter the situation where multiple adjacent pipe stations are at or near vapor pressure, and pressure spikes generated by the formation and collapse of vapor cavities oscillate between the stations. These oscillations can grow in amplitude and generate significant noise in the system. An example of this sort of noise is shown in Figure 1 below.
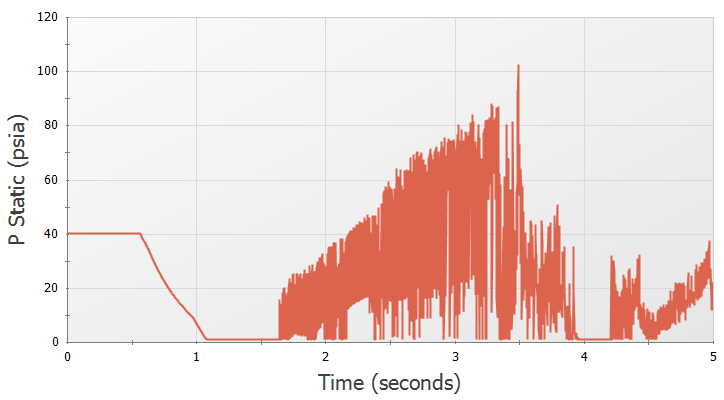
Figure 1: Numerical noise in the static pressure results for a pipe following the collapse of a vapor void.
When cavitation results with numerical noise are present, the engineer must attempt to see past the noise and find the major system trends. A key approach is by comparing results from each cavitation models. In many cases, DGCM will give results with less noise than DVCM. If both models show similar system-level trends, greater confidence can be assigned to the results without noise.
DGCM generally produces less noise than DVCM, but in some situations, DGCM can also see results with numerical noise, particularly when complex junctions such as relief valves or pumps with four quadrant curves are used. Results from each cavitation model should still be compared to evaluate what the true system response is.
Other Confidence Indicators
Numerous other indicators to help the engineer assign confidence to cavitation results exist. Discussing all of them is not practical, so four further indicators are described here.
-
Using DVCM vs. DGCM
Comparing results using DVCM and DGCM gives two independent sets of results to compare. If both cavitation models give similar results, higher confidence can be assigned to those results. If each model gives different results, they should be treated with lower confidence.
-
Sectioning
The sectioning scheme used for a model impacts the assumption used for both DVCM and DGCM that the vapor volume is negligible compared to the liquid volume in each section. As section count increases, the same vapor volume represents a larger percentage of the pipe volume. If results are stable as section count is changed, higher confidence can be assigned to those results. If results are not stable as section count is changed, it indicates the assumptions behind Impulse and its cavitation models are violated, and the results should be treated with lower confidence.
-
Vapor Void Formation and Collapse
Vapor void formation and collapse in a real system must behave realistically. The vapor voids must form and collapse in a continuous motion based on the presence of low-pressure waves. Multiple bubbles are likely to form, but if those bubbles are captured by a discrete model (like both DGCM and DVCM are), the model should show a single vapor void forming and collapsing rather than numerous voids with very short time spans.
If results show behavior consistent with expected physical behavior, higher confidence can be assigned to those results. If results show excessive noise or chaotic behavior, it indicates the cavitation model may not be giving a good representation of real results. Figures 2a and 2b below compare results which show behavior that is likely to be physically realistic compared to behavior that is likely to be numerical noise.
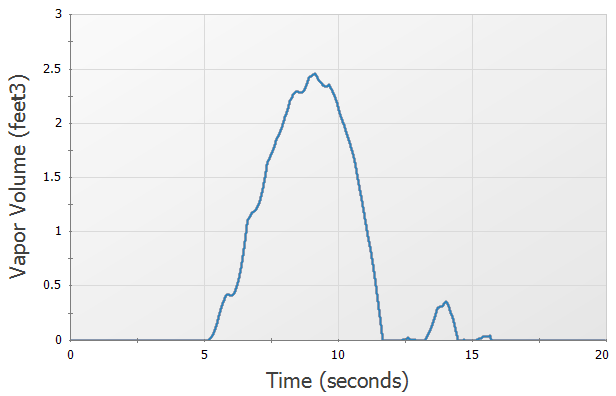
Figure 2a: Cavitation results showing smooth vapor void formation and collapse, adding confidence to the results.
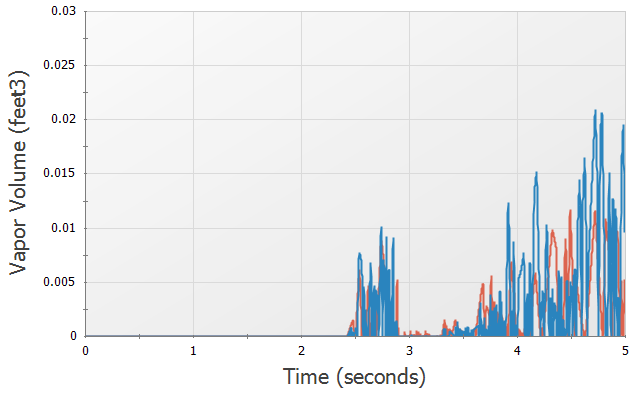
Figure 2b: Cavitation results showing noisy vapor void formation and collapse, limiting confidence in the results.
-
Disabling Cavitation Modeling
The uncertainty inherent to cavitation modeling can make it difficult to determine the shape and magnitude of a low-pressure wave which causes cavitation. Disabling cavitation modeling in Impulse can allow the engineer to better see the low-pressure wave in their system to determine the extent to which it is likely to cause cavitation and to determine if a subsequent high-pressure wave will form and violently collapse the vapor void.
Note that this step is only meant for troubleshooting purposes. AFT always recommends that cavitation modeling is enabled for transient simulations as all liquids have a vapor pressure and can experience cavitation.
Transient Forces
The transient forces calculated in AFT Impulse are intended to capture the imbalanced hydraulic loading on a series of pipes caused by a pressure wave moving through those pipes. In order to have confidence in the transient force results, we must also have confidence in the simulation’s pressure results.
Transient cavitation in a system inherently introduces uncertainty to the results. Specifically, it introduces uncertainty regarding the shape and timing of the pressure waves in the system. The magnitude of the transient forces calculated by Impulse is highly dependent on the shape and timing of those pressure waves, meaning that transient force results can have significant uncertainty when cavitation is present in a simulation. A Warning message is presented in the output to alert users of this uncertainty.
Engineers attempting to use transient force results for further analysis (e.g.: pipe stress analysis) when cavitation is present must carefully examine the cavitation results in their system to determine the level of confidence they can place in those results. The engineer should then apply a conservative safety factor to the transient force results before performing further analysis.
Detailed Decision Tree
Interpreting transient cavitation results is complex and rarely straightforward given that each system is unique and reacts to low pressures differently. The above discussion reflects that complexity by numerous approaches the engineer can take.
Two papers published at the 2018 ASME Pressure Vessels and Piping Conference attempt to give a more rigorous decision tree to help guide the engineer as they work to evaluate cavitation results in their system and apply safety factors within the context of ASME B31.3 code. The full papers are too lengthy to include here, but a summary is presented below. Full versions of each paper are available on our website.
Cavitation Classifications
Simulation results with cavitation can be broken into four categories based on the extent of cavitation:
-
None - No cavitation present in the system
-
Limited - Maximum vapor volume percent less than 10%
-
Major - Maximum vapor volume percent between 10% and 100%
-
Extreme - Maximum vapor volume percent greater than 100%
The Limited and Major categories are broken into further categories based on where cavitation occurs and the confidence assigned to the results.
Safety Factors for Pressure Results
Four levels of safety factors can be applied to maximum pressure results based on the extent of cavitation. These safety factors are used when the engineer is working to ensure the system pressures never exceed the rated pipe pressures.
-
Small - 1.25:1 - Used when no cavitation is present
-
Moderate - 1.5:1 - Used when limited cavitation is present and the engineer has higher confidence in the cavitation results
-
Large - 2:1 - Used when major cavitation is present or when limited cavitation is present, but the engineer has low confidence in the cavitation results
-
Very Large - 3:1 - Used when extreme cavitation is present, and the system cannot be miitgated to avoid cavitation
Safety Factors for Force Results
Three levels of safety factors can be applied to transient force results based on the extent of cavitation. These safety factors are used when the engineer is reporting transient force results for further pipe stress analysis. The recommended safety factors for force results are generally higher than those recommended for pressure results given the greater uncertainty.
-
Small - 1.25:1 - Used when no cavitation is present
-
Large - 2:1 - Used when limited cavitation is present and the engineer has higher confidence in the cavitation results
-
Very Large - 3:1 - Used when major cavitation is present or when limited cavitation is present, but the engineer has low confidence in the cavitation results
Related Blogs


