Graph Results Window
The Graph Results window, shown in Figure 1, allows users to generate high quality printed graphs.
The Graphing Panel offers several types of standard graphs for transient pipe or junction, profile, and force information. Users can also control graph content, plotting information for multiple parameters, junctions, pipes, paths, or scenarios simultaneously.
Results can be graphed as linear or log versus linear.
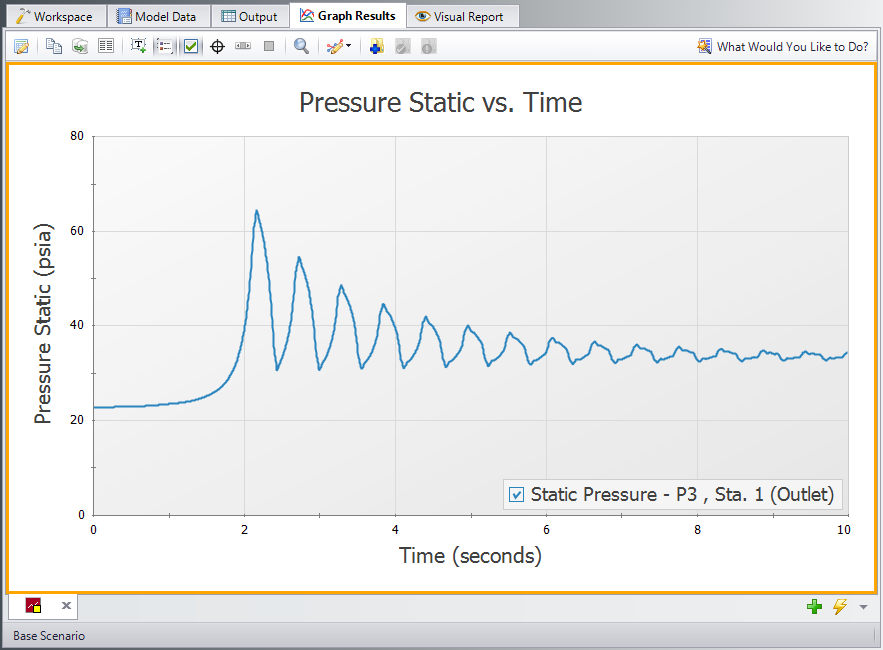
Figure 1: The Graph Results window offers full-featured plot generation
Allows the user to create, update, and even replace unique graphs that can be regenerated with new data. Multiple graphs can be displayed at the same time and organized into separate Folders. The default folder is named “My Graphs” and more folders can be created using the “New Folder…” icon on the Graph List Manager Toolbar or by right clicking on “My Graphs” and selecting “New Folder…”
Once a folder is created and selected, a Graph can be added to its list by selecting the “Add Graph to List” icon found on the Graph Results Toolbar. This can also be done by right-clicking anywhere on the graph. Once Graphs are in Folder individual Graphs can be generated in unique tabs or each Graph in a Folder can be displayed in a single tab by right clicking on the Folder and selecting “Load Current Folder Graphs in New Tabs” or “Load Current Folder Graphs in Same Tabs”. These options are available in the Graph List Manager toolbar as well. Other options that can be found by right clicking on a Folder or Graph in the Graph List Manager or on the toolbar are:
-
Load Graph in Current Tab – Regenerates the graph in the currently active tab.
-
Load Graph in New Tab – Creates a new tab and regenerates the graph there.
-
Load Current Folder Graphs in New Tabs - Regenerates all the Graphs in a Folder in separate tabs.
-
Load Current Folder Graphs in Same Tab – Regenerates all the Graphs in a Folder in a single tab
-
New Folder – Creates a new Folder where more Graphs can be saved to.
-
Move Graph Up – Moves the selected Graph up one level.
-
Move Graph Down - Moves the selected Graph down one level.
-
Rename Graph… - Changes the name of the Graph
-
Duplicate Graph – Creates a copy of the selected Graph with a new name.
-
Delete Graph – Removes Graph from the Graph List Manager
-
Move To Folder – Moves the selected Graph to a previously existing Folder or a new Folder.
Graph Results Toolbar
The Graph Results Toolbar also has many options that are available by right clicking on the Graph Results space at any point. These options are:
-
Select Graph Parameters – Select the type of Graph to create and its parameters.
-
Add Graph To List – Saves the Graph to the currently active list allowing it to be regenerated in the future.
-
Update Current Graph In List – Saves any changes to the current graph that have been made. (e.g. Changing the Graph Title or Line Style). Note that it is preferred to use the Replace Graph in List option if changes to the parameters or objects/paths being shown have been made.
-
Replace Graph In List – Replaces the graph highlighted in the Graph List with the current graph that is shown.
-
Copy Graph Image – Copies a .jpeg of the Graph to the clipboard
-
Copy X-Y Data – Copies the X-Y used by the Graph to the clipboard
-
Show Data – Displays the X-Y data used to generate the graph in a column to the right of the graph
-
Right-clicking on the x-y data set provides further options to find the maximum or minimum in the data set, create an annotation on the graph for a data point, or to copy an individual data point
-
-
Create Annotation – Add an annotation to the graph that can be formatted and saved to be reloaded with the Graph in the future.
-
Show Legend – Toggles the legend off and on.
-
Show Check Boxes in Legend – Adds a check box in the legend that allows the user to selectively turn off and on certain curves in a Graph without having to recreate a new Graph.
-
Show Cross Hair – Displays and cross hair that shows the cursors X-Y values along the X and Y axis. This also displays the nearest data point X-Y values in a tooltip. If this feature is used at the same time as "Show Data" the Cross Hair will focus on that highlighted data point and display its values in a tooltip. The user can also change what data point is highlighted with the arrow keys and the Cross Hair and tooltip will move to that datapoint.
-
Show Range Finder – Adds a toolbar at the bottom of the graph that displays the entire X axis, but allows the user to zoom in to a specific range by clicking and dragging the handles on either side of the range finder.
-
Show Junction Locations – Add a vertical line with the number of the junction labeled at the location of the junction along the flow length.
-
Manage Junction Locations - Allows junction labels on the graph to be shown/hidden individually.
-
Zoom to 100% - Resets the focus of the graph to 100%
-
Format – Allows the user to change the Graph’s format. Including
-
Header, Axis, and Legend names and fonts.
-
X and Y scaling
-
Line color and thickness
Graph Outline Colors
The active graph will always have an outline which indicates what state it is in.
-
Orange – Graph not added to list
-
Dark Green – Graph added to list
-
Light Green – Graph added to list, but changes have occurred. These can be saved and make they graph dark green by selecting “Update Current Graph in List”.
Graph Tab Icons
Each Graph Type has a specific color associated with it. This color will display in the box on the tab for the Graph. The colors are below:
-
Transient Pipe – Dark Red
-
Transient Junction - Dark Gray
-
Profile – Purple
-
Forces – Yellow
-
Frequency - Light Brown
-
Blank Graph – Light Gray
These tabs also display if the Graph in the tab is not saved or has been changed from the original Graph List item by showing a small yellow square over the tab's icon. If the current graph has been saved, there will be no yellow square.
Graph Tab Actions
-
New Tab – Creates a blank tab in which a new type of Graph can be generate and added to the Graph List Manager
-
Tab Actions
-
Close Active Tab
-
Close All Tabs
-
Close All But The Active Tab
-
Two Vertical Tab Groups
-
Two Horizontal Tab Groups
-
Reset to Single Tab Group
-
Tabs on…. – Selects the location of tabs (defaults to the bottom of the Graph)
-
Graph Tab Selection – Selects a Graph for the Graphs currently in the tabs based on name.
Printing and Exporting
The Graph Results image can be:
-
Copied to the clipboard
-
Saved to a picture file
-
Saved directly to an Adobe PDF file
-
Sent to the printer
The x-y data in the Graph Results graph can be:
-
Copied to the clipboard
-
Exported to a delimited file suitable for direct importing into spreadsheet software
Animations of graphs can be saved as .wmv or .mp4 files.
Data Point Limitations
By default, the maximum number of data points Impulse will plot for an individual graph is 500,000, though users can change this limit under the General -> Other section of the User Options window. This limit is in place to help ensure users do not encounter memory issues related to plotting large numbers of data points. The allowed range of data points plotted is 10,000 - 1,000,000. The data point limit is applied to an individual graph. Two parameters plotted as stacked graphs count as two separate graphs. Two parameters plotted with one as a secondary y-axis graph count as one graph. One parameter plotted for two scenarios on the same graph counts as two graphs (i.e. the data point limit is essentially doubled from a single-scenario graph to a two-scenario plot graph).
When a user attempts to generate a graph that exceeds the maximum number of data points, Impulse will skip data points in order to remain under that limit. The frequency of skipped data points is proportional to the amount by which the generated graph exceeds the maximum number of data points. When data points are skipped, there is the potential for important data points to be excluded from the graph such as maximum or minimum values.
Users can take the following steps to avoid running into this issue, and to double-check that the graph gives an accurate representation of the results and does not skip any maximum or minimum data points:
-
Increase the limit in the User Options window (the time required to load a graph will increase)
-
Plot fewer curves in the graph
-
Graph data for limited amounts of time rather than the entire simulation time
-
Save fewer output data points from the Simulation Mode/Duration panel
-
Double check results shown in the graph with transient output shown in the Output window. Users can either reference the Transient Output, showing output values for every time step and pipe section data is saved for, or examine the Transient Min/Max values shown for the parameters selected in the Output Control window.
Related Blogs


