Graph Types
AFT Impulse offers several types of graphs to help users better understand and interpret their data. Each type of graph is given a brief description below. Starting with AFT Impulse 8, users are also able to plot output for multiple scenarios in a single graph, which is also discussed below.
Transient Pipe
Transient pipe results can be plotted against time for any pipe station that is saved to the output file. By default, only the inlet and outlet stations for each pipe will be saved to the output file. The Output Pipe Stations panel allows the user to specify which pipe station data will be saved. Each pipe is shown in an expandable list. When a pipe is expanded, the pipe stations for which data was saved are shown. These pipe stations can be added to the list on the right to be included in the graph by either double clicking the parameter, or highlighting the parameter and using the right arrow button.
The user can plot the data for the entire simulation, or for a user specified time frame.
One or more parameters can be graphed by using the Add button with the green plus sign. The Remove button can be used to eliminate extra parameters. Parameters can either be plotted in stacked graphs, or two parameters can be plotted on the same graph using the secondary axis. To move a parameter to the secondary access, add it below the parameter that will be on the primary access, then click the right blue arrow button, or double-click on the gray square to the left of the parameter. This will cause the parameter to be indented, as shown in Figure 2.
Further, if Design Alerts are specified for the pipe (e.g., max/min operating pressures), these can be cross-plotted against the transient data by selecting the check box under "DA".
![]()
Figure 1: Creating a graph with a parameter on the secondary axis.
Transient Junction
Similar to transient pipe results, transient junction results can be plotted vs. time for any junction that is saved to the output file. Junction data includes items such as pump speed and accumulator volume. These are specified in the Output Junctions panel.
Profile
This graph category allows users to plot the selected parameter(s) along a flow path. In order to generate this graph, the specified pipes in the Select Graph Parameters window that comprise the path must form a single, continuous path. If they do not, an error message will appear listing the pipes which are preventing the path from being continuous. The independent variable in these graphs is the length along the flowpath.
A path of pipes can be specified in one of two ways. First, the user can select the pipes in the displayed list. Additionally, you can select the path on the workspace, and then use the Workspace button on the Select Graph Parameters window to automatically select all pipes currently selected on the Workspace. These methods permit that only a single path to be specified.
One or more flow paths can be specified using groups. Only those groups that consist of a continuous pipe sequence will be displayed as an option in the Select Graph Parameters window.
The results can be the values at a particular point in time, or the overall maximum and/or minimum values. You can also cross-plot the max/min values, the steady-state results, and Design Alerts. This is done clicking the check boxes underneath "Mx" for maximum, "Mn" for minimum, "SS" for steady-state, and "DA" for design alerts.
All profile graph types support animation. There are two animation options: Animate Using Output File, and Animate Using Solver. These are discussed in Animating Transient Results.
Forces
If transient force sets have been defined in the Force Definitions panel, the resulting force data can be plotted vs. time. Force sets selected from the list of defined force sets will be plotted. The unbalanced transient force data can be plotted for the entire transient simulation, or the user has the option of selecting a specific time frame to display.
This force data can also be exported for analysis in pipe stress analysis software.
Frequency
(PFA module only) As part of the pulsation frequency analysis, the tab will appear to plot the frequencies identified for the system. More information on this can be seen in Pump RPM Evaluation in the PFA Module.
Multi-Scenario Graphing Features
Starting with AFT Impulse 8, users can plot information from multiple scenarios in the same plot. In the Select Graph Parameters window, the button for 'Multiple Scenarios' allows users to select the scenarios in the model they wish to plot for a particular graph. The scenarios being plotted in the graph must have the same pipe layout for all scenarios, but can have different sectioning in AFT Impulse 9. In AFT Impulse 8, all scenarios must have the same Analysis Setup settings including sectioning, start time, stop time, and number of data points saved for all scenarios being plotted in a graph.
The active scenario must be included in a multi-scenario graph. When creating a new graph, users are not able to deselect the current scenario. When a user loads a saved Graph List Item that does not include the active scenario, Impulse will add the active scenario into the Graph List Item, but will not save the active scenario into it.
Scenarios can be selected using the Multi-scenario... button as shown in Figure 2 below.
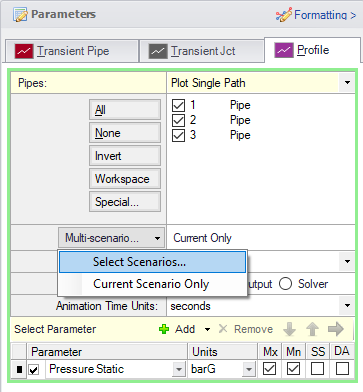
Figure 2: Graph Parameters window showing Multi-scenario selection options
Related Topics
Related Examples
Related Blogs
Five Fantastic New Features for Fast Fluid Transients: Impulse 8


