New in Version 4
End Transient Run Feature
Impulse and xStream now offer more flexible ways to end a transient simulation, with new options that go beyond stopping at a predefined time. In addition to time-based termination, users can now choose to halt a run when a specific transient event occurs or when a user-defined Design Alert is triggered. Design Alerts, which typically highlight when a pipe or junction reaches a set condition—such as "If the pressure exceeds X in pipe Y"—can now be used to stop the simulation entirely. When a run ends due to an event or alert, the simulation output is truncated, a checkpoint file is created for easy restarting, and an informational message is added to the Message Manager. This enhancement gives users more control and efficiency when modeling transient behavior.
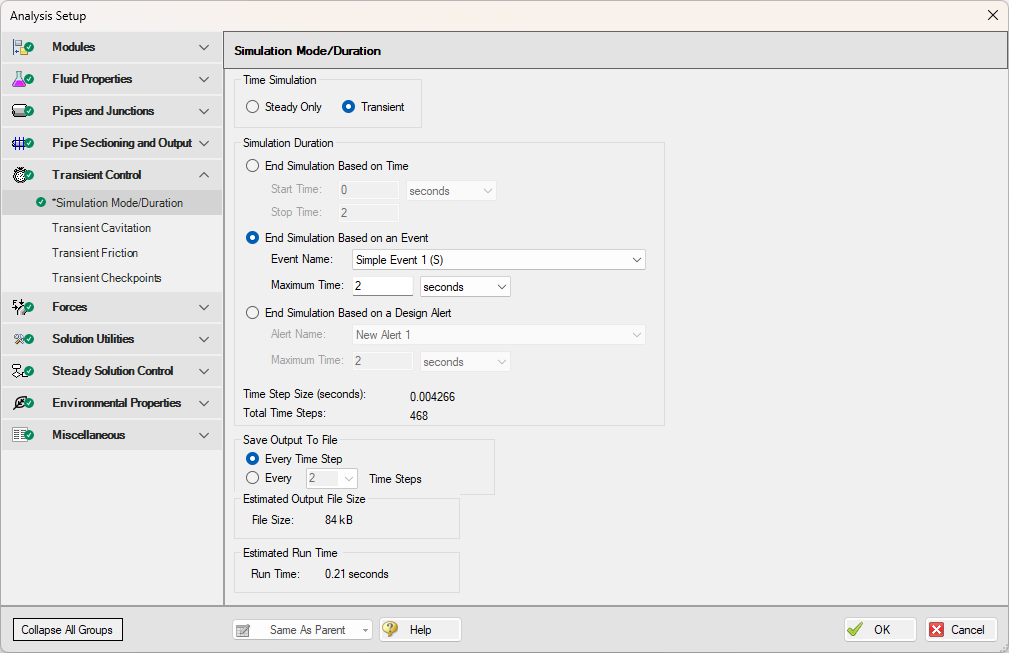
Figure 1: Simulation Mode/Duration with options for End Simulation Based an Event or Design Alert
Parametric Study Tool
The Parametric Study tool enables rapid and in-depth simulation analysis, allowing users to explore a wide range of input parameters efficiently. By systematically varying inputs, the tool helps identify critical factors affecting system performance, enhancing sensitivity analysis and optimization. Engineers can gain clear insights through graphical trends, even in cases where traditional goal-seeking methods struggle. This approach facilitates better decision-making by providing visual justifications for key trade-offs, such as cost versus performance.
With its ability to generate full scenario analyses and optimize operating conditions, the tool empowers users to make data-driven decisions confidently. Whether pinpointing essential calibration components or presenting compelling reports for stakeholders, this solution offers a streamlined, intuitive approach to simulation analysis—enhancing efficiency, accuracy, and overall system success.
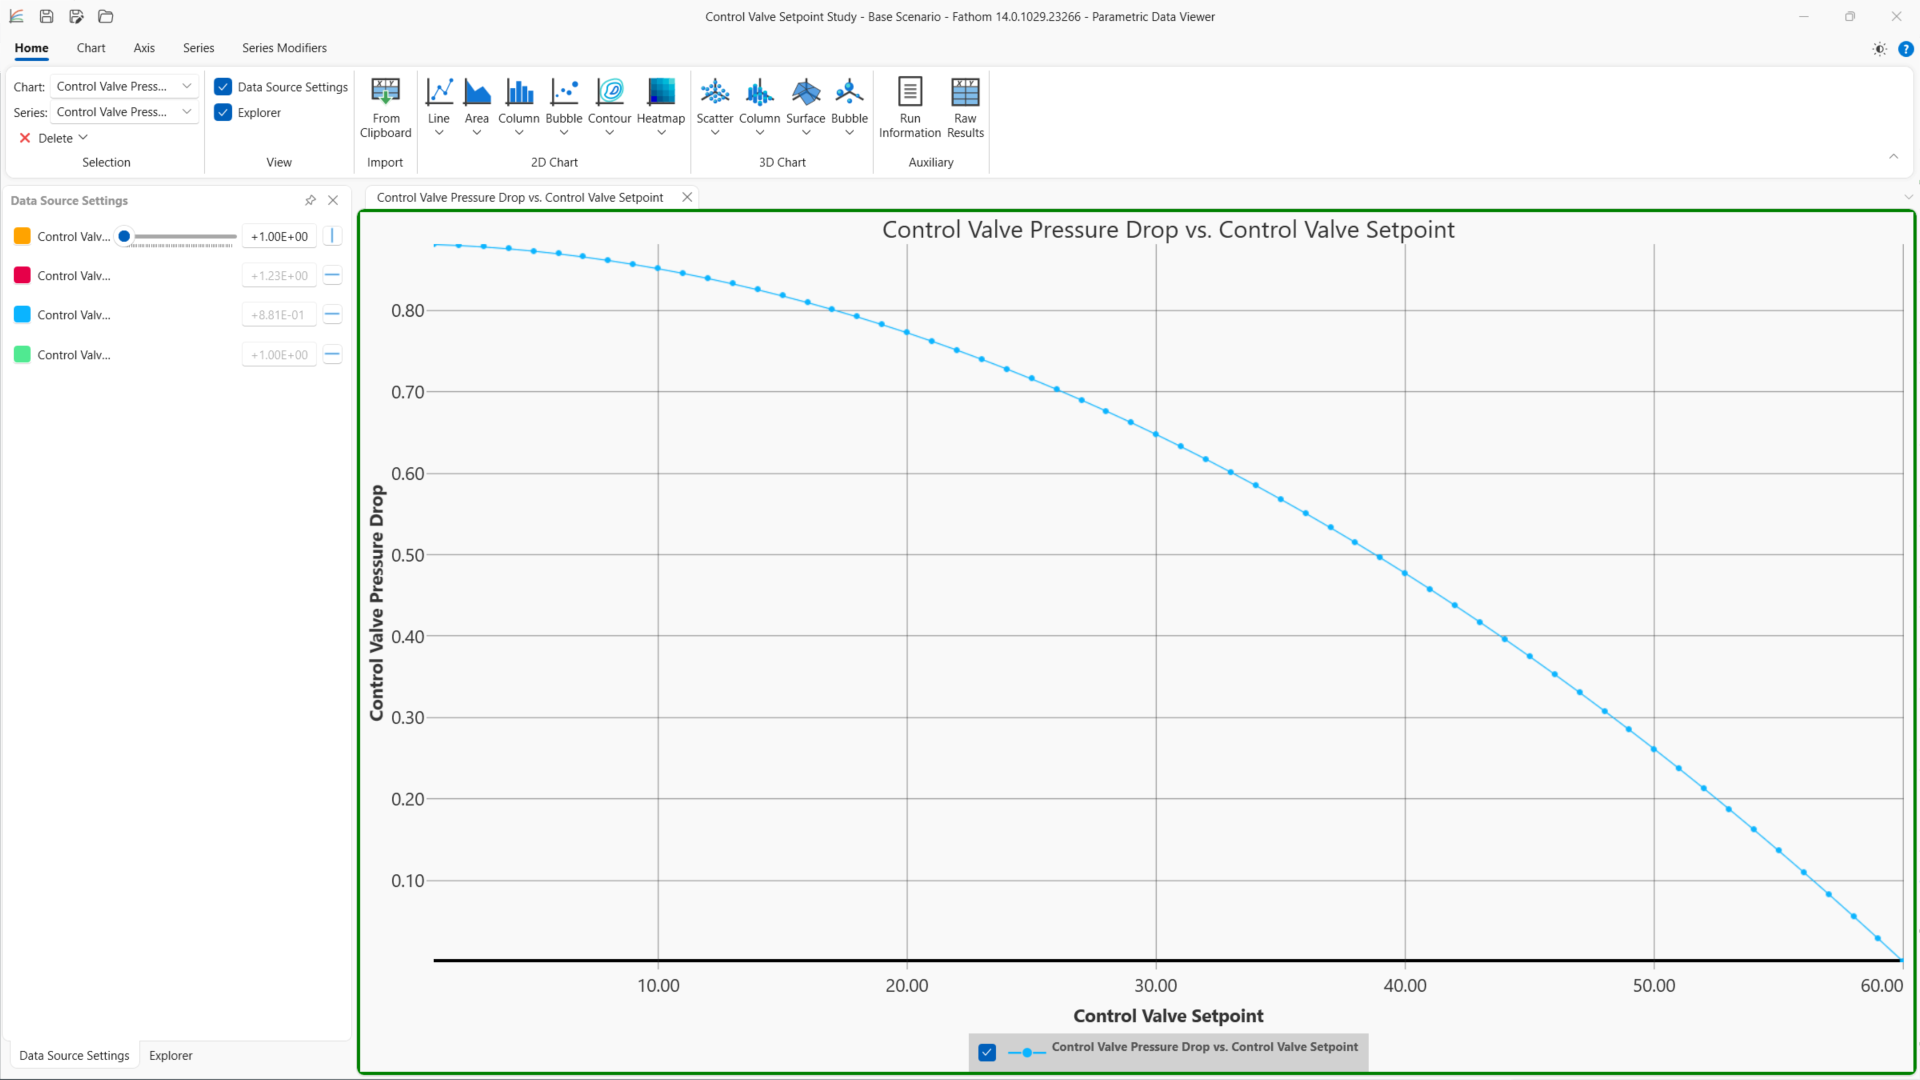
Figure 2: Parametric Study tool
Graph Annotations
Graph Annotations is a new feature designed to enhance modeling workflows by allowing users to add auto-updating graphs directly to their Workspace. These graphs provide instant insights by visually comparing model results without requiring users to navigate elsewhere. Fully resizable, movable, and easily hidden, they function like Color Map layers, updating automatically based on Output data. By bringing the capabilities of the Graph Results tab to the Workspace, this provides a streamlined approach to reviewing key data, improving efficiency and decision-making.
Creating a Workspace Graph is simple—users can add a Graph Annotation from the Toolbox, select a desired plot, and configure parameters. Once set, the graph refreshes automatically with new Output data, ensuring up-to-date insights. This enhancement makes analyzing complex scenarios more intuitive and user-friendly, offering a smarter, more visual way to interact with model results.
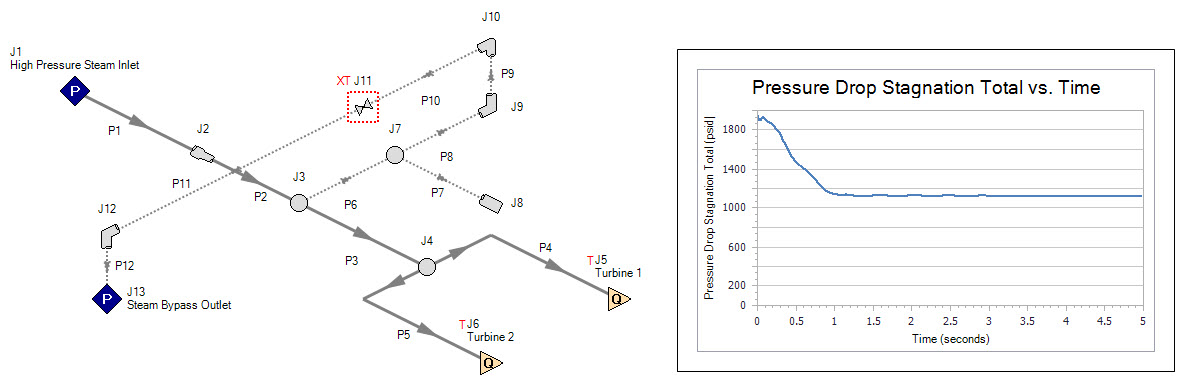
Figure 3: Graph Annotation Used on the Workspace
Design Alert Layer
The Design Alert Layer is a new feature designed to enhance model performance visualization and analysis. It provides color-coded indicators on the Workspace to highlight objects that have violated Design Alerts. Each affected object is labeled with the specific condition and evaluated value, eliminating the need for manual checks. This feature streamlines model analysis by identifying and highlighting areas of the Workspace that are exceeding user-set system requirements. Multiple Design Alerts can be viewed at a single time, helping to quickly identify locations of the model that need attention and review for a range of different system conditions.
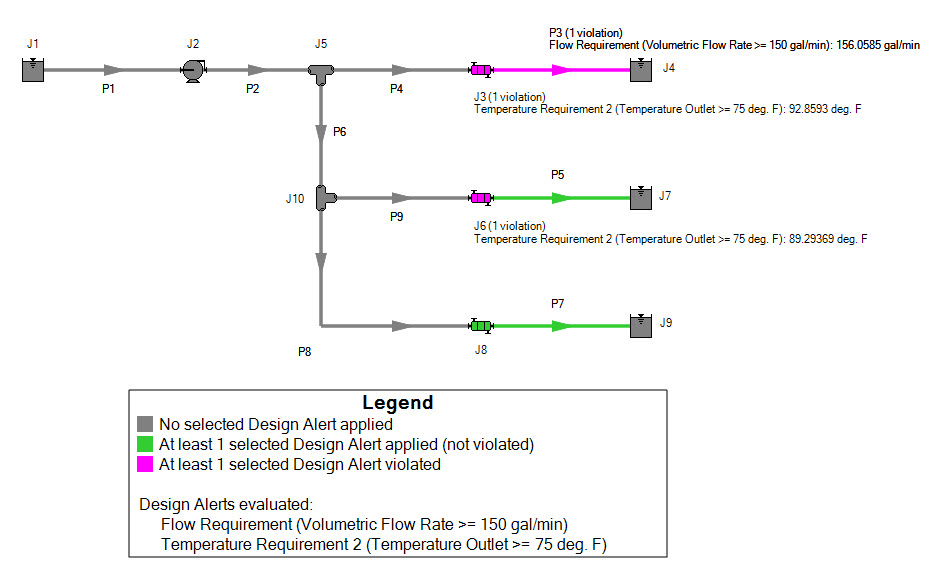
Figure 4: Design Alert Layer Appearance on the Workspace
Scenario Comparison Layer
The Scenario Comparison Layer enhances clarity in scenario analysis by visually highlighting differences between the current scenario and a selected comparison scenario, whether explicitly chosen or related by one degree (Parent, Sibling, or Child). Objects with differences are color-coded on the Workspace, allowing users to quickly identify differences between the scenarios. Each modified object provides an easy way to inspect specific parameter and value differences through the object labels and the Inspection Window. This update delivers the capabilities of the Scenario Comparison Tool through a much more visually appealing and intuitive layer, streamlining the analysis process and improving user efficiency in interpreting complex models.
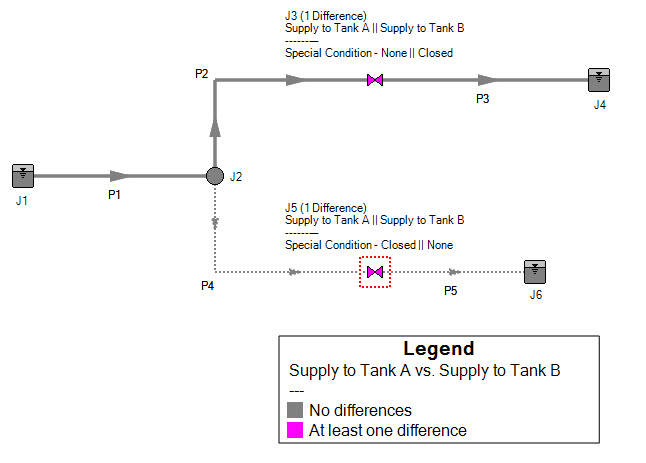
Figure 5: Scenario Comparison Layer Appearance on the Workspace
Other Notable Features
- Pulsation Frequency Analysis (PFA) Workflow Improvements -
Pulsation Frequency Analysis (PFA) Workflow Improvements streamline setup and give users greater control and flexibility. The updated workflow now supports estimated cutoff frequency values in Natural Frequency Evaluation mode—no longer requiring user-specified inputs. A user-adjustable speed buffer allows for more precise customization, while the redesigned Pulsation Frequency Analysis panel (formerly "Pulse Setup") features a clearer, more intuitive layout.
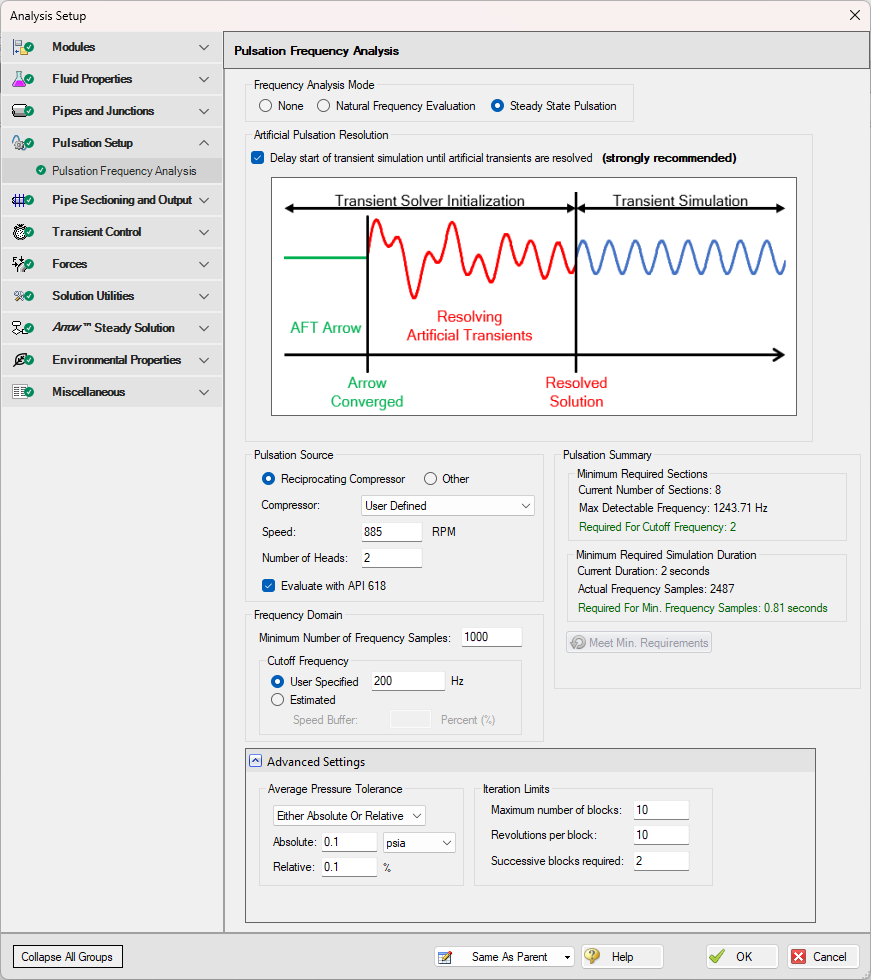
Figure 6: Updated expanded Pulsation Frequency Analysis panel in the Analysis Setup window
-
Force Amplitude vs Frequency Graphs - Visualize pulsation effects seamlessly.
Introducing the new Force Amplitude vs Frequency Graphs PFA feature in Impulse and xStream — a powerful enhancement to the PFA Add-on Module designed to elevate your pulsation frequency analysis. This tool allows you to seamlessly create Force vs Frequency (pulsation “shaking force”) graphs for selected Force Sets directly within the software, eliminating the need for external Fast Fourier Transform (FFT) processing. This new graph type applies an FFT to the Force vs Time data, allowing you to effortlessly visualize force amplitudes across a range of frequencies, making it easy to identify resonances, assess pulsation effects, and detect inefficiencies. This feature enables clear, data-driven frequency domain analysis, giving you deeper insights and streamlined reporting for optimized system performance.
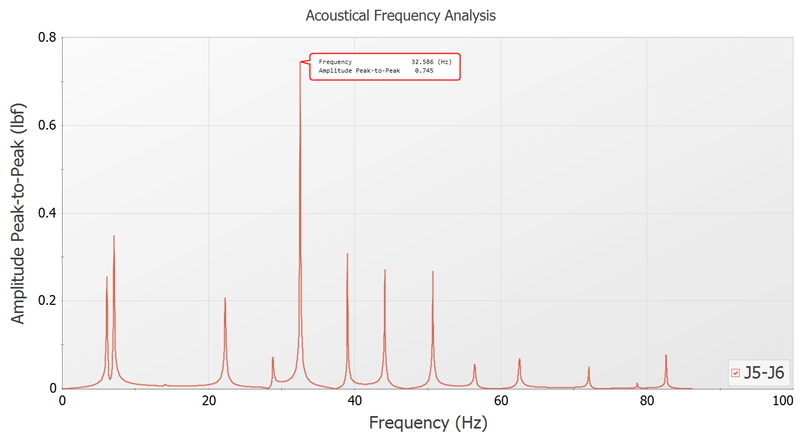
Figure 7: Acoustical Frequency Analysis graph
- Improved PCF Importing - Enhanced PCF import control and accuracy.
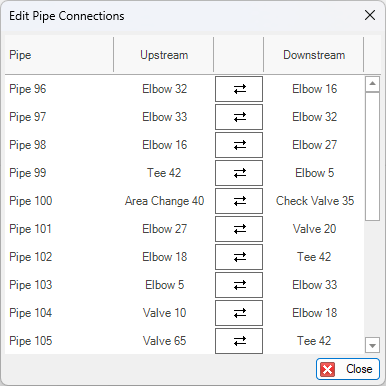
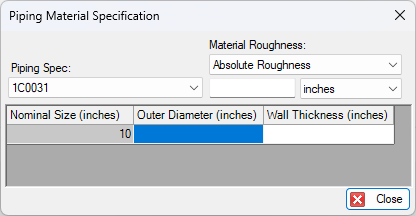
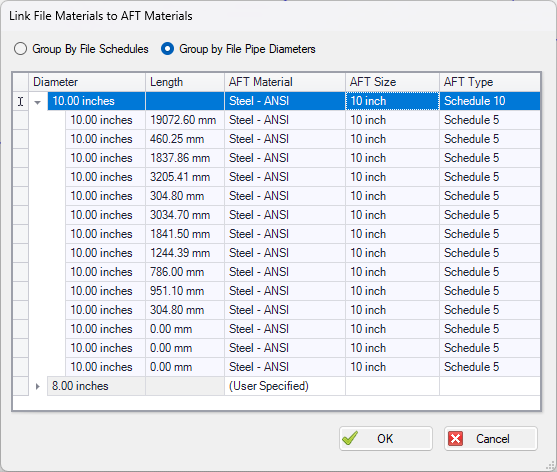
The Improved PCF Importing feature provides greater control over how PCF file elements are brought into the Workspace. Multiple PCF files can now be imported at once, streamlining batch workflows. Pipe length units can be adjusted directly in the import preview. A new window also makes it easier to define pipe materials during import, reducing the need for post-import editing.
|
|
|
Figures 8, 9, and 10: New tools for greater control over PCF imports
-
Global Junction Morph - Convert multiple junctions from one type to another.
The new Global Junction Morph feature streamlines model updates by allowing you to convert multiple junctions of one type to another—all at once. Ideal for refining model details or adapting to design changes, this tool delivers a faster, more consistent way to restructure your system and save valuable engineering time.

Figure 11: The Global Morph window allows multiple junctions of the same kind to be selected for transformation to another junction type
Miscellaneous Improvements
-
General Layer Improvements
-
Consolidate Label and Object visibility controls
-
Reintroduce ability to vary pipe thickness with diameter
-
Ability to create layer from current Output Control settings
-
Remove “All Objects Layer” in favor of global ability to turn Layers on or off
-
Add column to Annotations list that allows inclusion/exclusion of annotation in specific scenarios
-
“Name” for pipes/junctions is now blank by default, removed “Name” as default Output Control parameter
-
Ability to create Layer Folders
-
Save and Load layer definitions to/from file to allow sharing of standard formatting among different models
-
-
Library Improvements
-
Allow Creation/Editing of Libraries Other than the Local User Library
-
New IPS and DIPS HDPE Piping Material Libraries from ASTM F714
-
Convert Fractional Values for Geometry to Numbers When Importing Fittings
-
-
Output Grid Improvements
-
Selection Calculations - Count, Numeric Count, Max, Min, Sum, and Mean will be displayed for selected cells in Quick Access Panel
-
Delete a Column - Right click to remove column from display and Output Control
-
Enhanced Selection - Holding shift will select range, holding control will allow disconnected selections
-
Include Headers on Copy - if an entire row or column is selected, the result will include the row/column header
-
-
General UI Improvements
-
Missing or Invalid Input Indicated with Exclamation Point and Tooltip Throughout
-
Report Time Step in Solution Progress Window
-
Refresh Help Iconography for Consistency
-
Faster loading and more responsive Workspace - Scenario load and Workspace refresh time has been reduced up to 90% for large models
-
-
General Modeling Additions and Improvements
-
Force Set Export 700% Faster
-
Extended Junction Parameter Consistency Checks - Complex junction types can have many potentially invalid parameter combinations, which are checked before the run to prevent unnecessary model execution and avoidable errors or warnings
-
Password Protection for Read-Only Files or Scenarios - Password protect files to be read-only to avoid inadvertent changes or erasing the results
-
Export pipe and junction names with IDs - Generating a consolidated list of all pipes and junctions and their corresponding ID numbers would be very helpful when it comes to using Excel Import more efficiently.
-
First Row of Transient Data Initialized with Steady Values - This will keep transient data consistent with the steady-state input value
-
Allow Specification of Backup File Directory
-
Allow PNGs for Imported Images
-
-
Miscellaneous
-
Removed references of "AFT" to reflect our new Datacor branding strategy
-
Installation: Moved to Typical Windows Directories (Program Files)
-
Licensing: Check for eLicenses First
-
Licensing: Add Computer Name to Diagnostic
-
Removed Visual Report Tab
-
Change "Transient data did not extend to stop time" Message to Information level
-
Make Valve Characteristic Percentage Increments Integral Values
-